Monthly Archives: January 2015

Veeam B&R

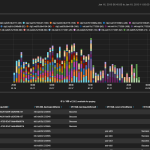
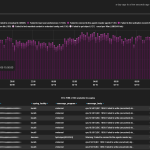
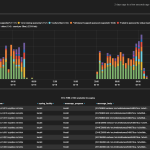
The VeeamBR dashboard template is based on SNMP traps that you can configure from the Veeam Backup console. On every VM/job event, a trap is sent to SexiLog and parsed by logstash. .    . Based on job names, the VeeamBR dashboard helps you visualize jobs progression over time: .    Read more →

vMotion pre-copy rate

As described in VMware vSphere vMotion Architecture, Performance and Best Practices in VMware vSphere 5 Performance Study: Because the virtual machine continues to run and actively modify its memory state on the source host during this phase, the memory contents of the virtual machine are copied from the source vSphere host to the destination vSphere host in an iterative process. The first iteration… Read more →

NFSLock

The NFSLock dashboard is a compilation of the major NFSLock issues like Busy, Not found, exclusive lock or Invalid handle: .   If you need to troubleshoot, for instance start|stop accessing issues, just deactivate other filters to focus on your needs:     Associated VMware KB articles: http://kb.vmware.com/kb/2016122 http://kb.vmware.com/kb/2046165 http://kb.vmware.com/kb/2037507 http://kb.vmware.com/kb/2013834 http://kb.vmware.com/kb/2009718   Read more →

Failed To *

The FailedTo dashboard is a simple Kibana topN query on the failed_to field. This field is created everytime logstash see something like “failed to do something“. In the screenshot below, you may have noticed a lot of “Failed to write” which was actual SIOC alerts because of a storage issue.   Read more →

IORM

The IORM dashboard is designed to let you have a quick look on the SIOC (aka Storage I/O Control) latency of your datastores. If you see some unexpected high latency here, go check on your monitoring-less SAN team 🙂 Datastore latency is one of the most important storage performance counter to look at. Having high storage latency could dramaticaly impact your VM performances. . . This dashboard… Read more →

Kommandantur

Kommandantur is the most critical SexiLog’s dashboard. When something becomes wrong, you’ll know it in real time. Kommandantur is based on a massive amount of log analysis. We know ESXi logs and spent countless hours on Logstash filters. Even unknown suspicious events are catched by the Local6 events histogram which also contains vmkwarning and severity:error logs . Well known alerts are displayed… Read more →

Quiescing issues

You probably already have encounter snapshot quiescing issues during VM backup jobs. The quiescing dashboard lets you visualize all types of error causes. .   Ultimately, you will use the Micro Analysis or the Terms Panel features of Kibana on the vmx_name field to fetch the top VM list: .   Read more →

vMotion downtime

During the vMotion hot migration process, the moved VM is quiesced/stunned very shortly for multiple steps (pre-copy, vmdk closing/opening, etc…). At the end, the global downtime (in µs) is reported in ESXi logs (the vpx.vpxa.config.log.level advanced settings must be set to verbose at least to log vmotion downtime): . <166>2015-01-21T14:19:52.163Z esx.domain Vpxa: [355FBB90 verbose ‘Default’ opID=task-internal-1-19c63550-49-6c-4c-cb-b9-fb] [MIGRATE] (1421849981469328) vmotion result has downtime value… Read more →