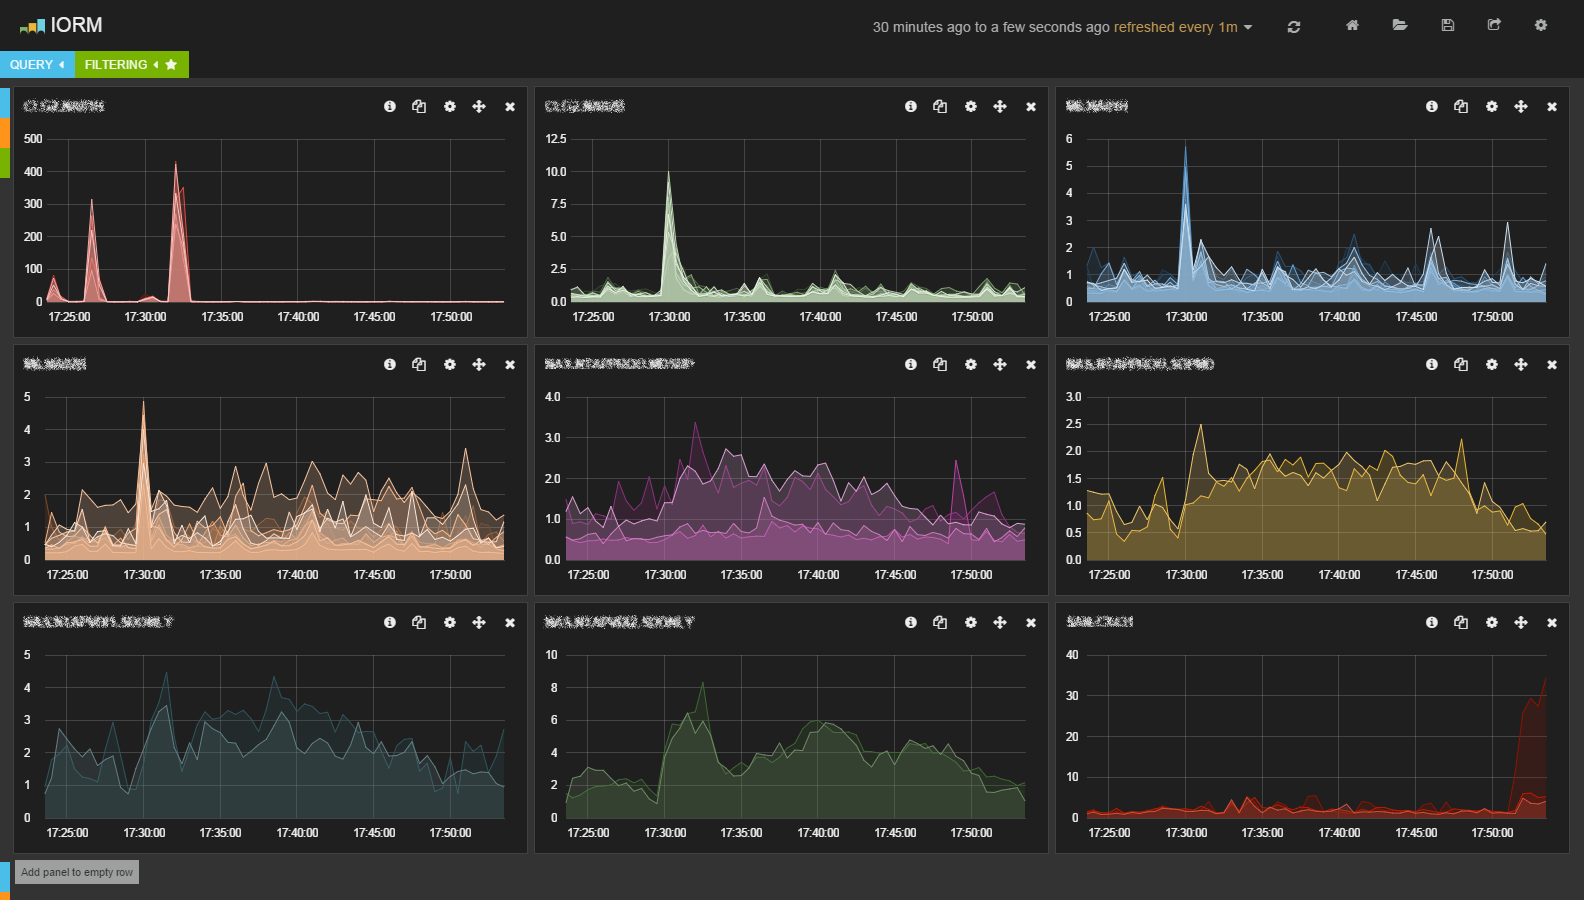
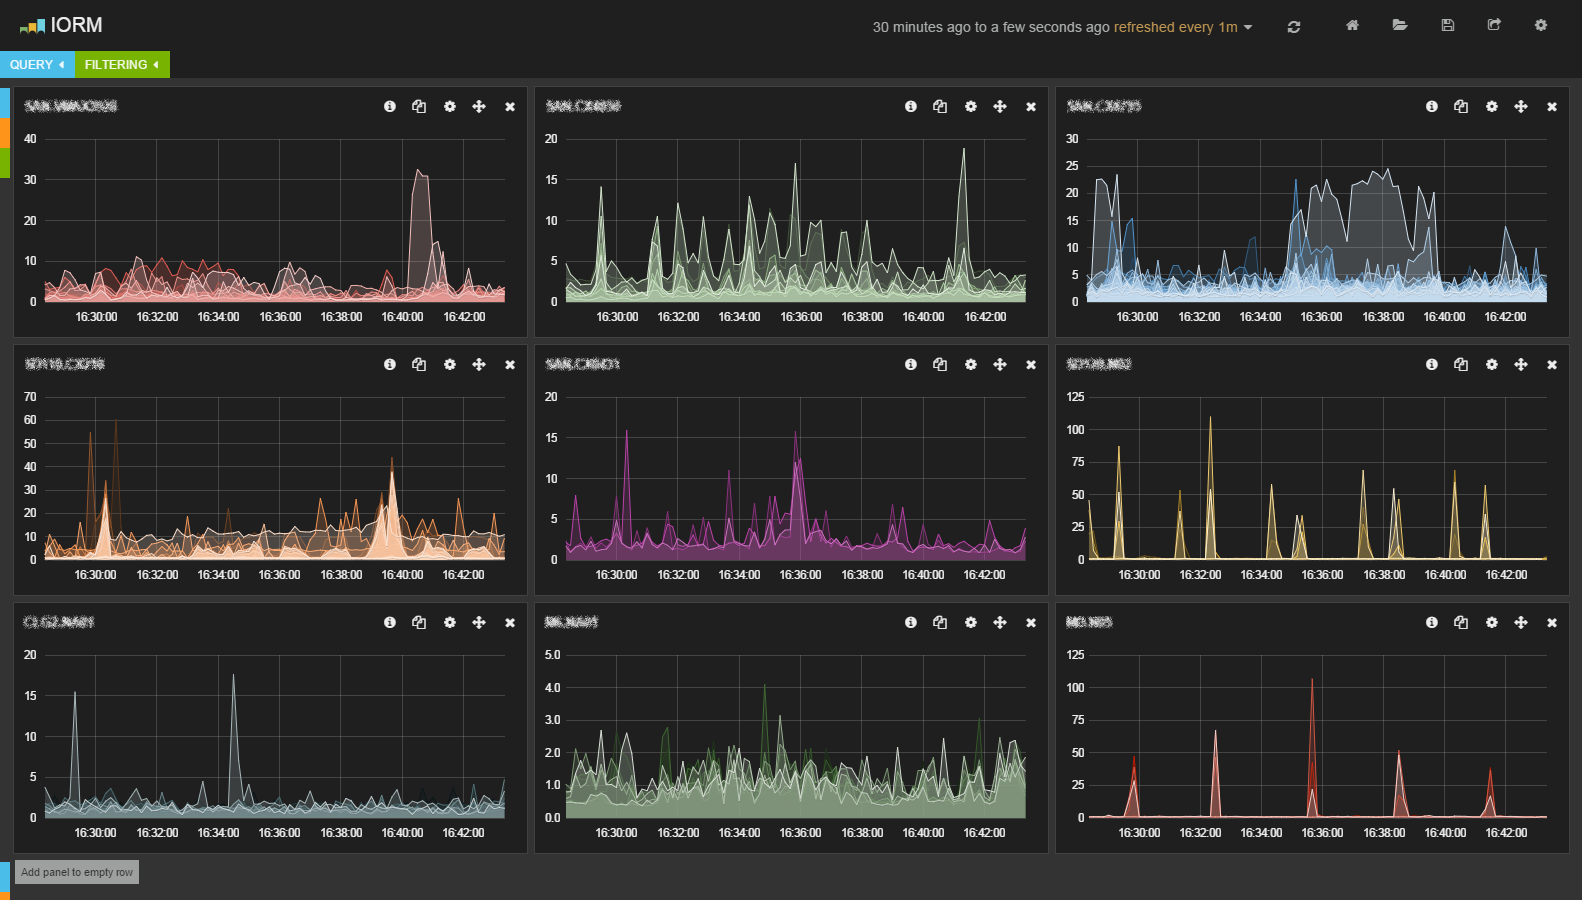
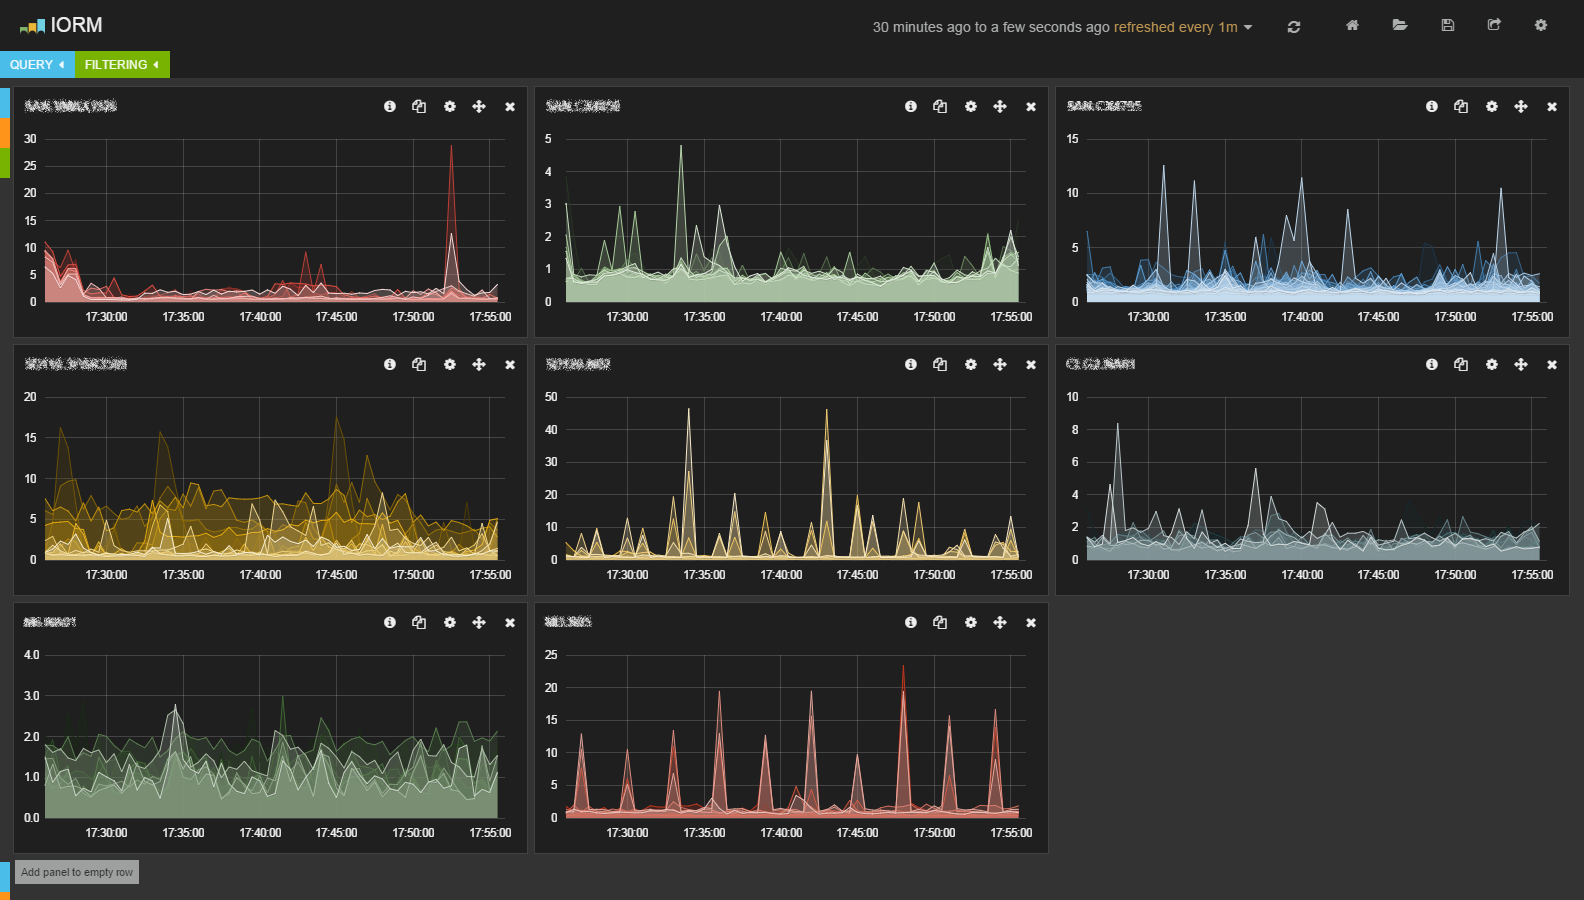
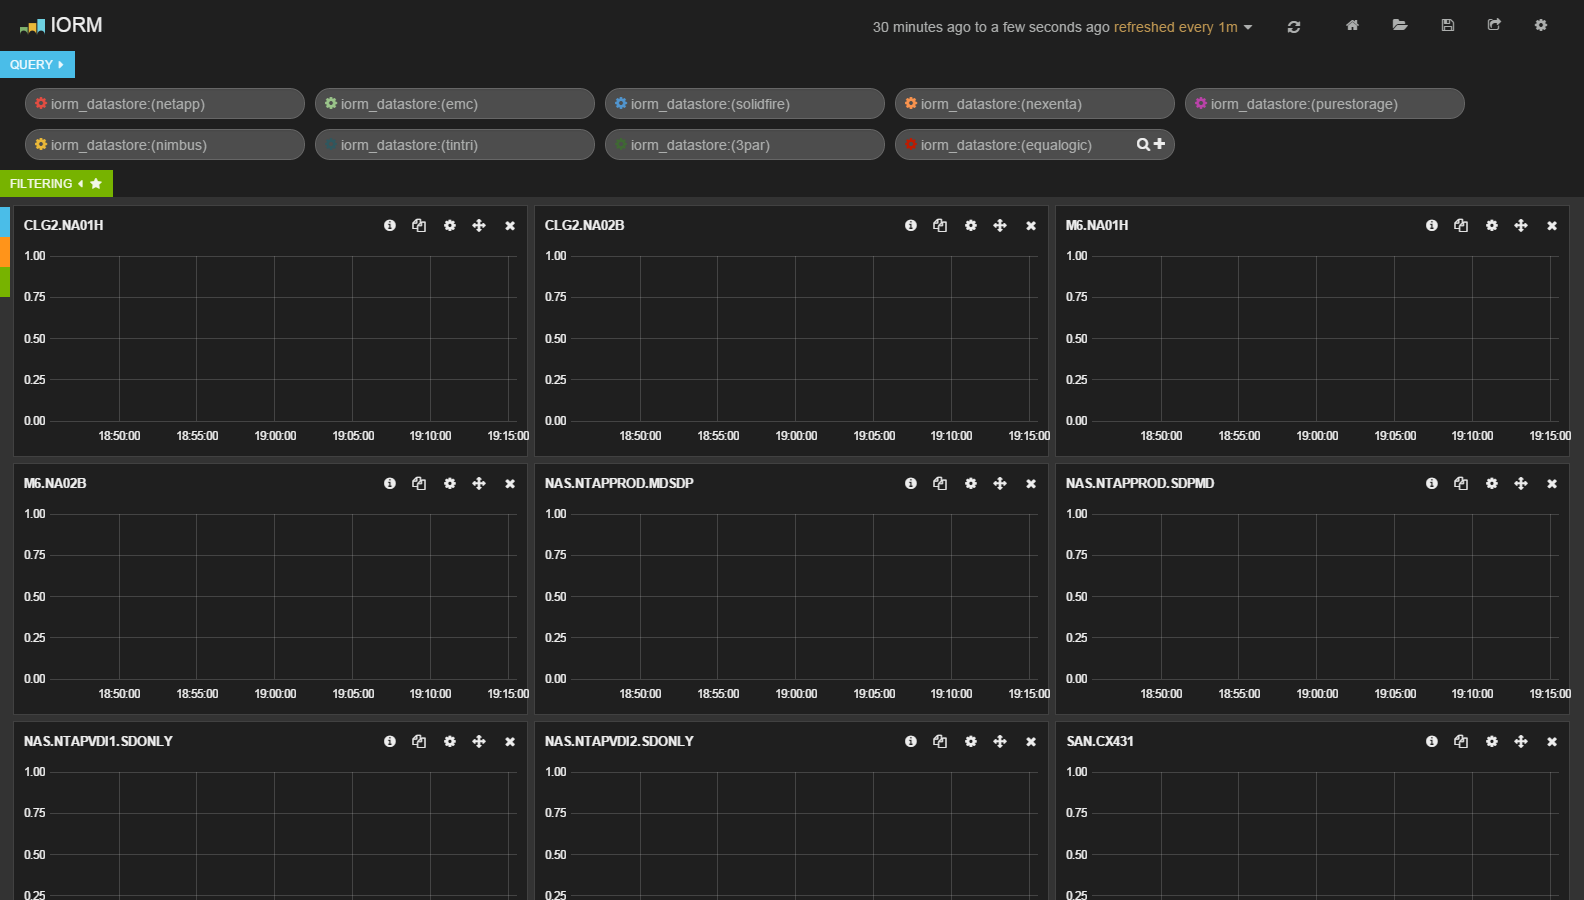
The IORM dashboard is designed to let you have a quick look on the SIOC (aka Storage I/O Control) latency of your datastores. If you see some unexpected high latency here, go check on your monitoring-less SAN team 🙂
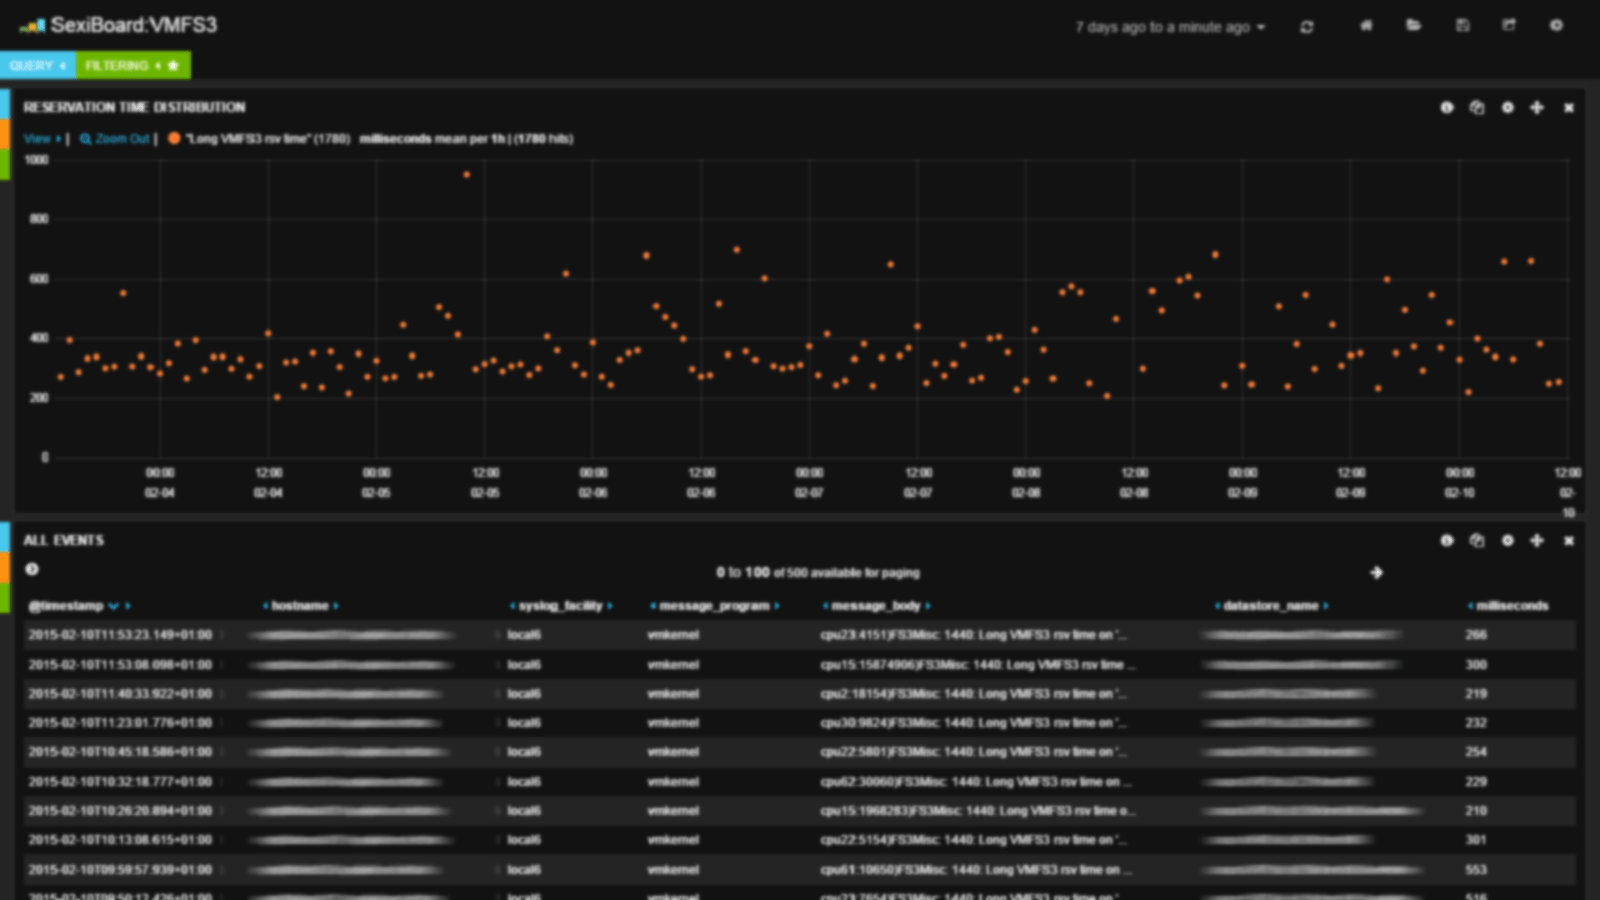
Datastore latency is one of the most important storage performance counter to look at. Having high storage latency could dramaticaly impact your VM performances.
.
.
This dashboard is actually a template and needs a bit of configuration. You first need to enable SIOC logging on your ESXi servers and then replace the storage vendors names by your datastore ones in the queries. Since this dashboard is meant to display datastore latency per storage controller/array, you can use paterns like san.vmax.* or nas.netapp.* or any leading caracters you’re using to manage your datastores.
.
2014-12-10T18:33:04.910Z esx.vmware.com storageRM: 2707630 avglatency= 0.83 iops= 84 threshold= 30 Win = 30.00 ws= 30 devqdepth= 30 iocount= 4 noio= 0.00 coio= 0.05
https://gist.github.com/sexibytes/208bce7977a3f224a4ce
1 comment for “IORM”