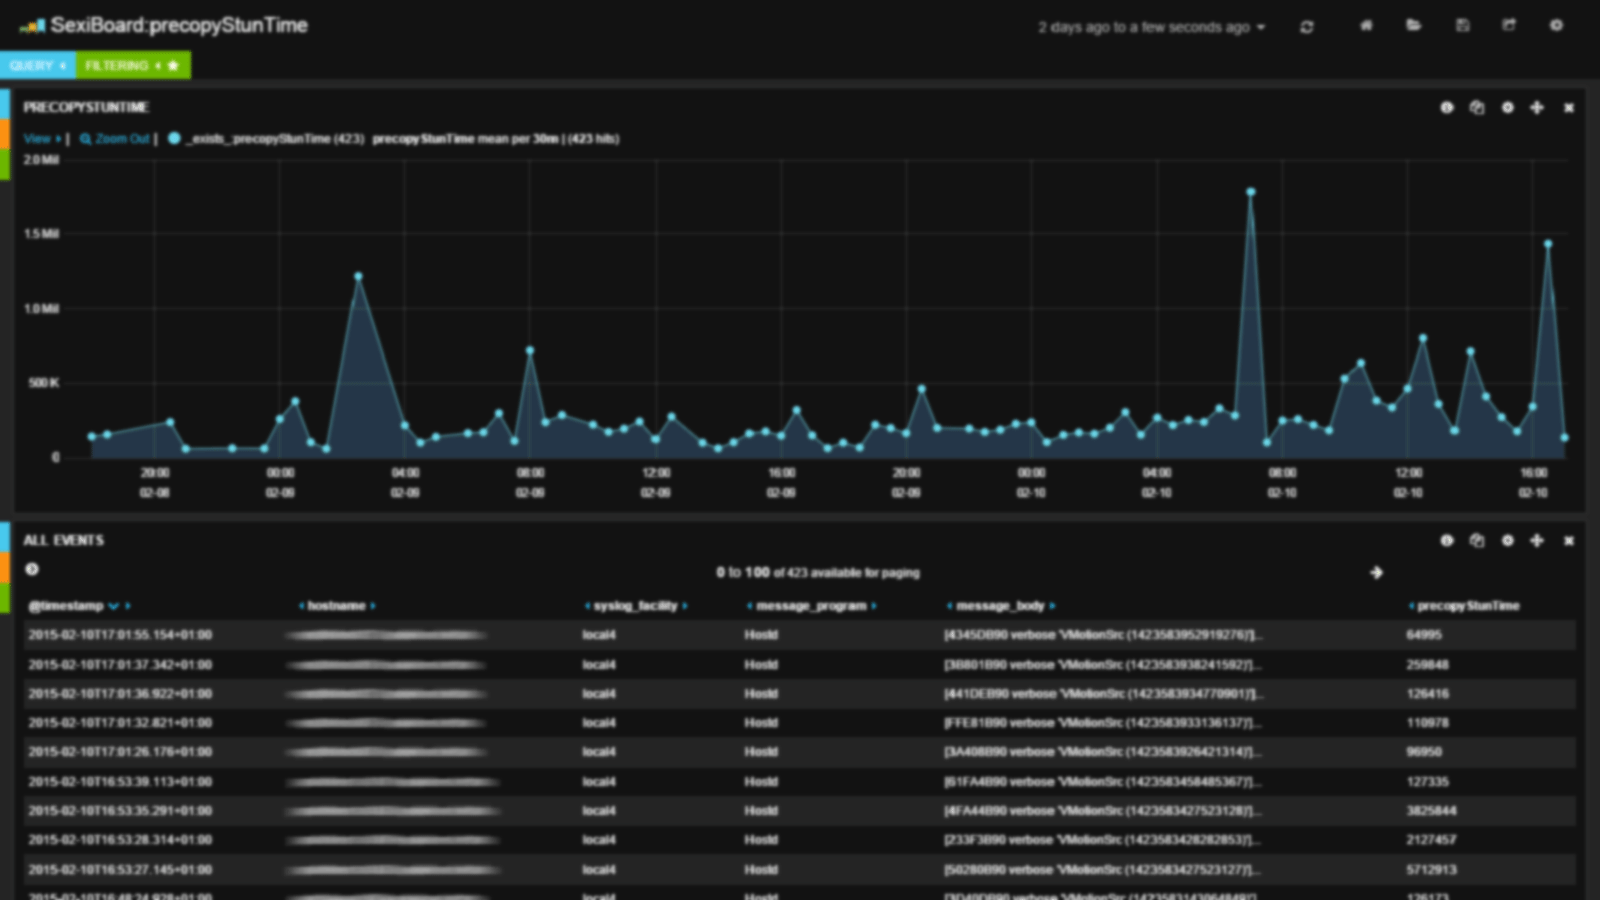
During a mini VSAN outage (disk full), we collected some critical logs and made a quick dashboard out it:
.
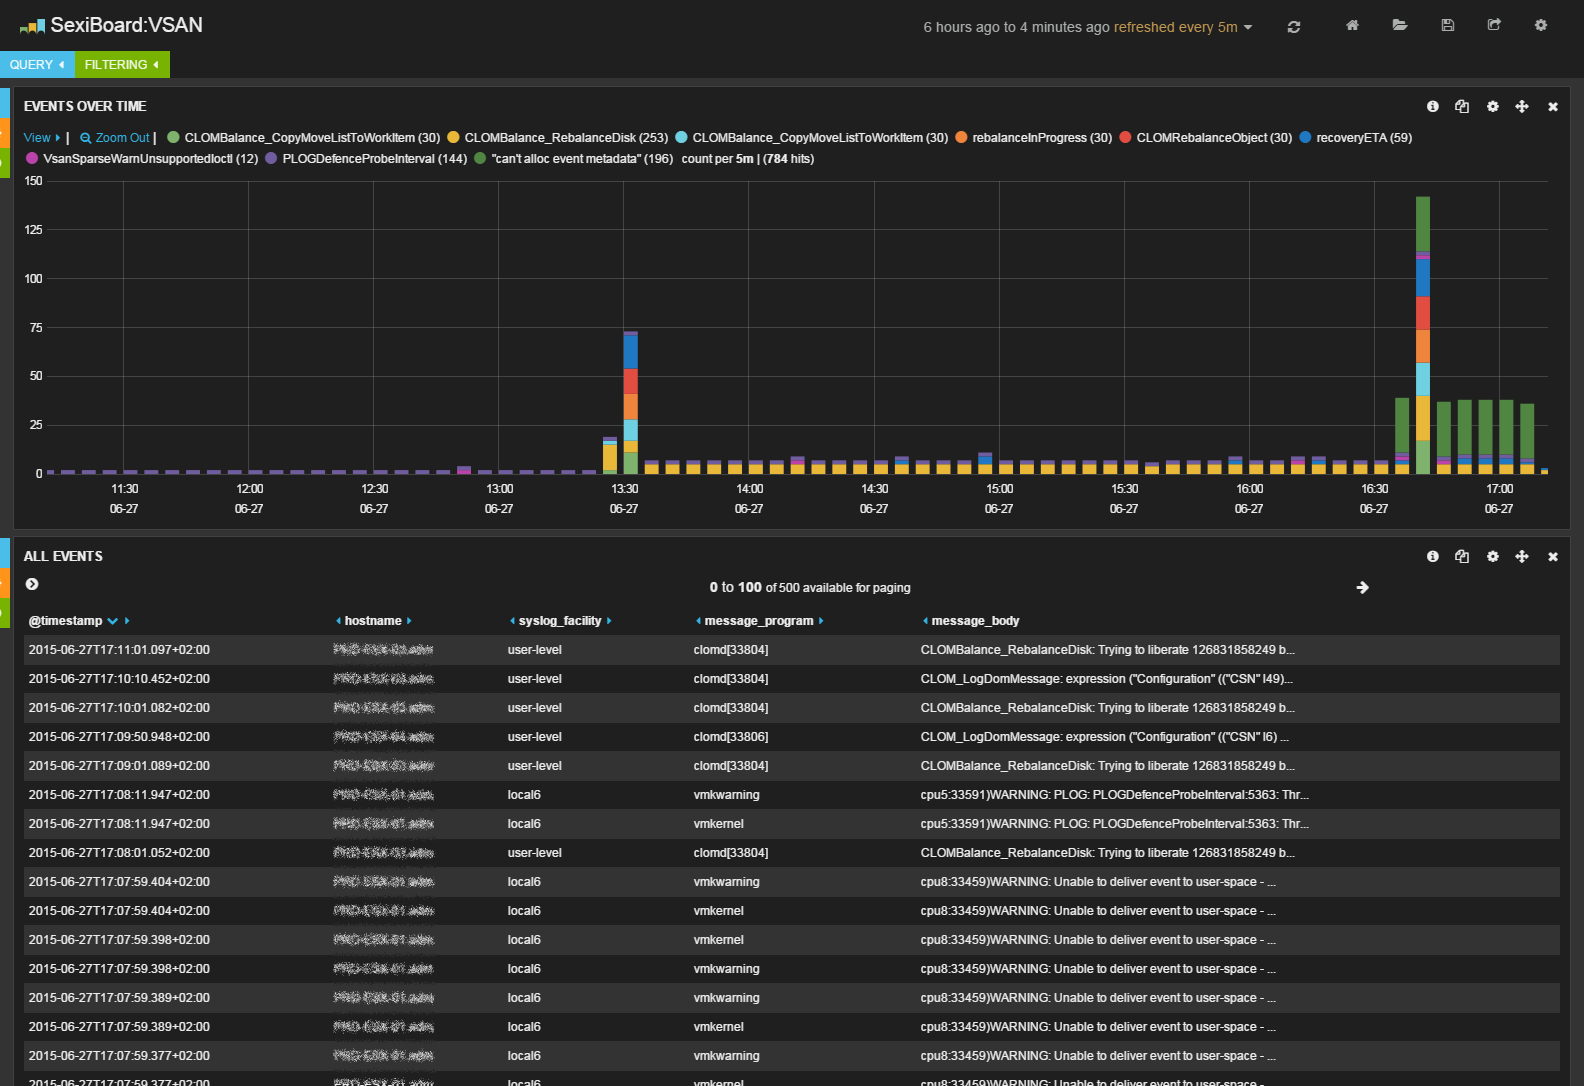
2015-06-27T14:33:01Z PRD-ESX-03.adm clomd[33804]: CLOMBalance_RebalanceDisk: Trying to liberate 126831858249 bytes from disk 5299e143-070f-22d6-836f-fca7d91952c4 (Cap:990191288320 Used:990191288320) in normal mode
2015-06-27T11:30:00Z PRD-ESX-02.adm clomd[33804]: CLOMBalance_CopyMoveListToWorkItem: Rebalance component 39f78655-dfcb-1208-dcc0-44a842147fac of object bdf68655-ef99-97ee-230a-44a842147fac to 52831702-ae93-04d8-9f03-0713551e3f41
2015-06-27T11:32:03Z PRD-ESX-03.adm clomd[33804]: Setting rebalanceInProgress to TRUE
2015-06-27T11:30:06Z PRD-ESX-01.adm clomd[33803]: Sync" l0) ("recoveryETA" i0) ("faultDomainId" 55494b93-2bec-840a-54b8-44a842147fac) ("flags" i0) ("nVotes" i0)) bd5d8755-2865-2654-7783-44a842145c12 5212501e-8f31-d27c-2754-3577b4cd7fcd))))
2015-06-21T00:11:51.617Z PRD-ESX-03.adm vmkwarning: cpu21:33459)WARNING: Unable to deliver event to user-space - can't alloc event metadata
2015-06-21T00:12:21.836Z PRD-ESX-04.adm vmkernel: cpu33:32801)WARNING: PLOG: PLOGDefenceProbeInterval:5363: Throttled: PROBE_INTERVAL should > IO timeout. Using IO timeout value for probe interval.
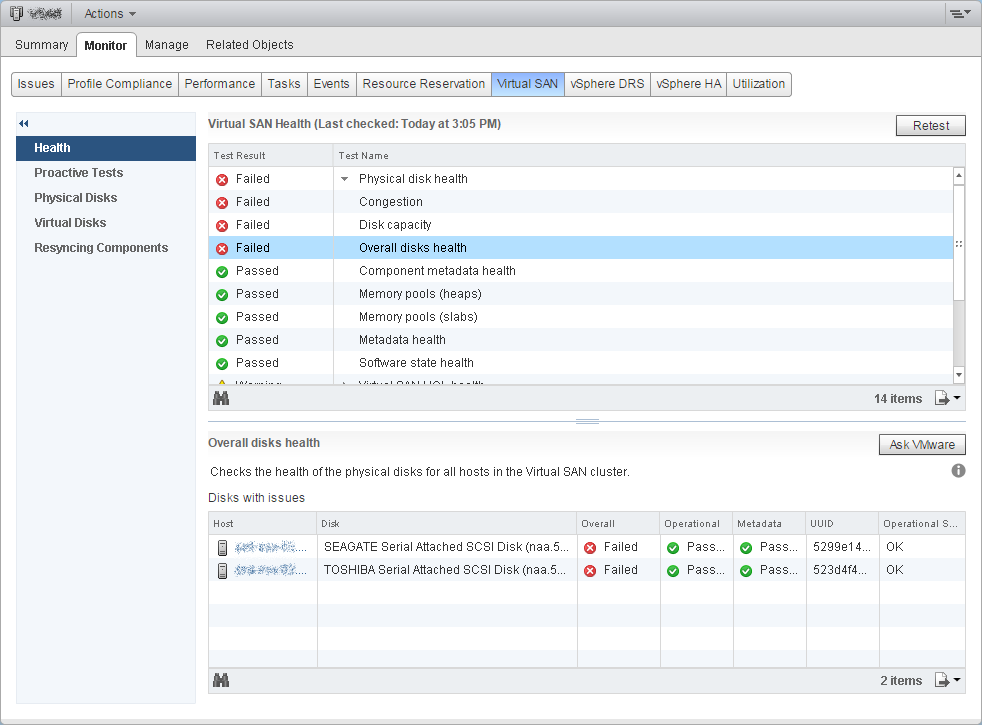
Virtual SAN Health Service – Physical Disk Health – Disk Capacity
And don’t worry, your Kommandantur dashboard is already VSAN aware:
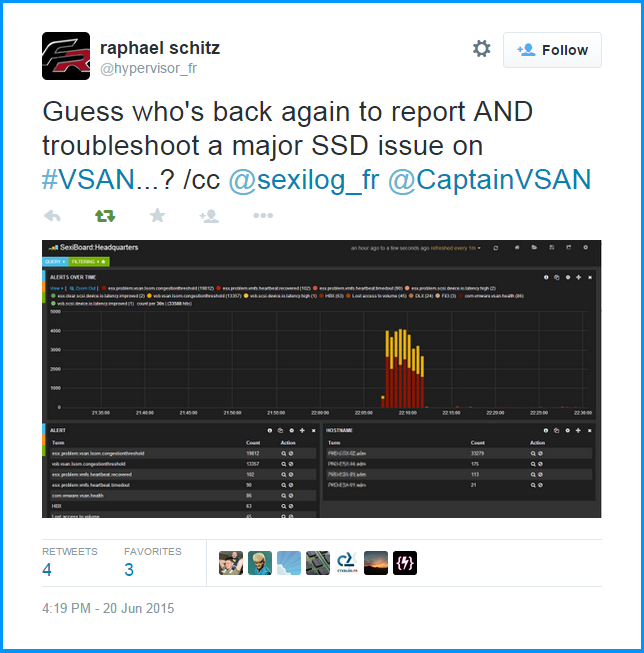
This dashboard is an early version and will very likely evolve over time, stay tunned!
This dashboard is embedded in SexiLog. If you want up-to-date version for your own platform, the Gist code for this dashboard is:
https://gist.github.com/sexibytes/5dd76bf2f061cdfe9466More information about dashboard import in Kibana is available here