Here is how you can get and quickly setup this awesome appliance named SexiLog.
.
Step 1: Get SexiLog
.
7cb35001b04080370ba7e34bb3113d784b880025 SexiLog.ovaIf you prefer to build it yourself, you can follow the Cookbook
.
Step 2: Deploy
SexiLog appliance aimed to be deployed on a VMware vSphere™ environment which can be achieve via several ways:
- vSphere client (http://pubs.vmware.com/vsphere-50/topic/com.vmware.vsphere.vm_admin.doc_50/GUID-6C847F77-8CB2-4187-BD7F-E7D3D5BD897B.html)
- vSphere Web Client (http://pubs.vmware.com/vsphere-55/topic/com.vmware.vsphere.vm_admin.doc/GUID-AFEDC48B-C96F-4088-9C1F-4F0A30E965DE.html)
- VMware OVF Tool command-line utility (https://www.vmware.com/support/developer/ovf/)
.
Step 3: Configure
SexiLog is pre-configured in DHCP mode but it’s possible to switch to static mode thanks to SexiMenu (this tool is launched automatically when you connect via SSH/console or can be launched with/root/seximenu/seximenu.sh).
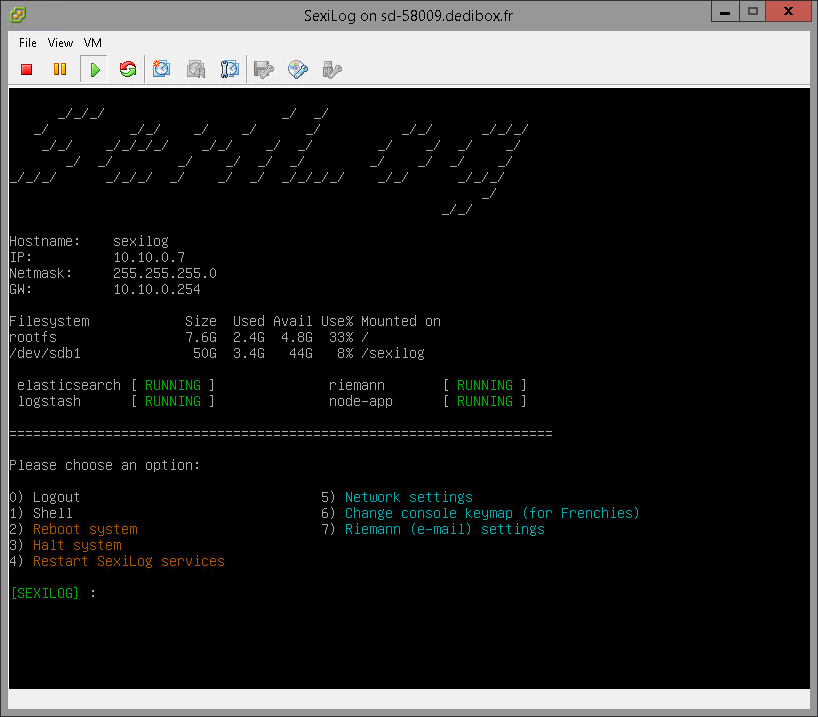
Beside menu 0) to 4) that matches common operations which are self explanatory (logout, access to shell, reboot or halt system, restart SexiLog services), menu 5) to 7) let you configure appliance network, keymap (useful for console troubleshooting on azerty keyboard) and configure Riemann settings (for e-mail alerting).
Step 4: Redirect ESXi syslog
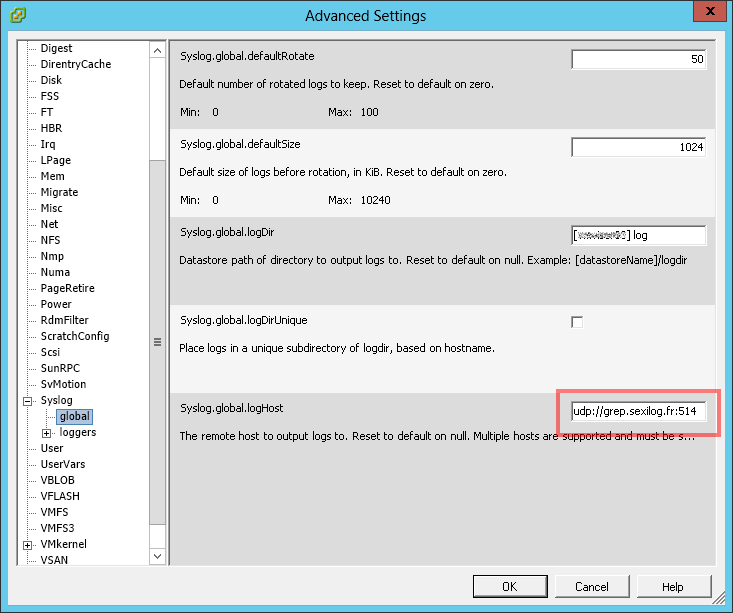
To make VMware ESXi™ send logs to your SexiLog appliance, you need to add udp://your_appliance_fqdn_or_ipv4:514 in the advanced option Syslog.global.logHost:
You can use this PowerCLI script to automate the task: http://blogs.vmware.com/vsphere/2013/07/log-insight-bulk-esxi-host-configuration-with-powercli.html
As instructed by the VMware KB2003322 you may need to open the VMware ESXi™ firewall to let the syslog traffic pass through.
.
Annex: Credentials & URL
The default root password is Sex!Log. The default keyboard layout is Qwerty US.
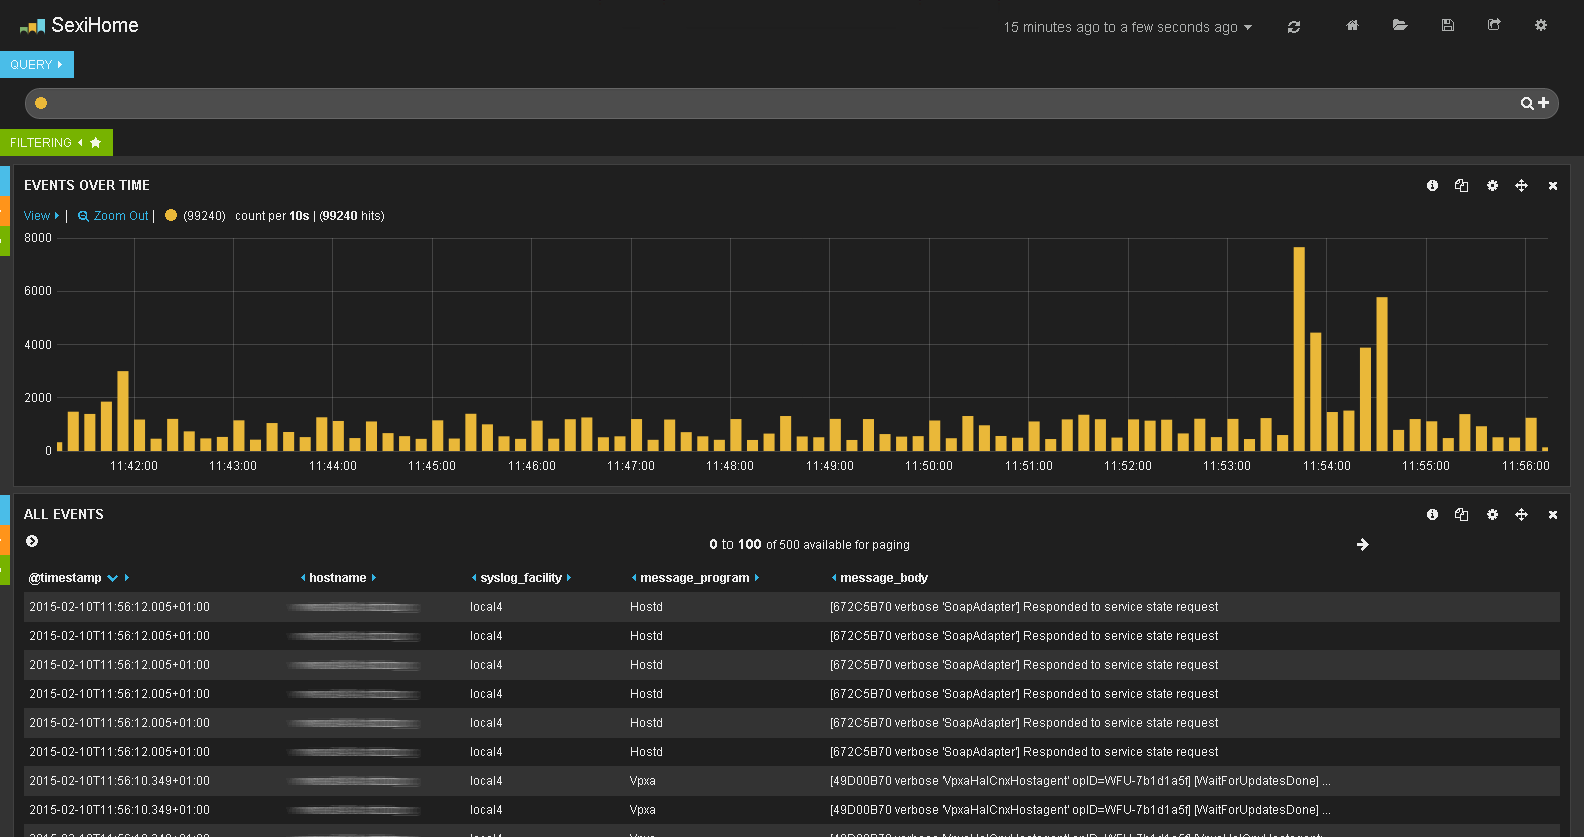
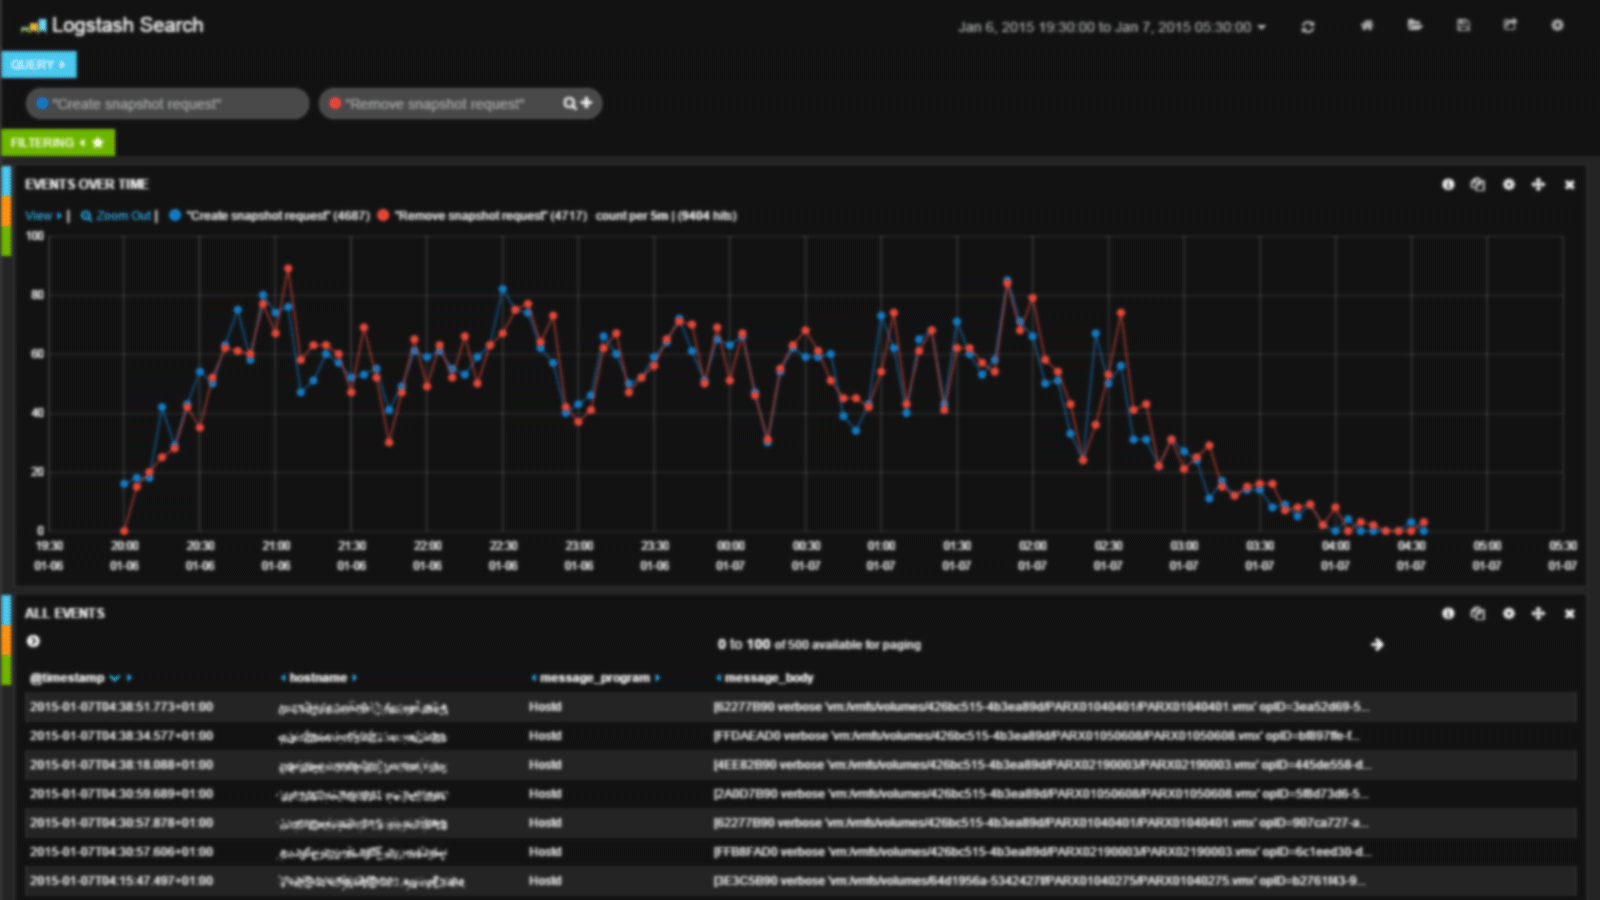
The SexiLog web interface (ie Kibana) is listening on TCP port 80 so you can reach it at http://your_appliance_fqdn_or_ipv4/
.