Hard drive extension
By default, SexiLog is published with 2 hard disks. The first one is dedicated to the system and host / mount point. The second one (50GB) is dedicated to /sexilog and is used to host all elasticsearch, logstash and kibana data.
If you want to extend the second disk, you should follow these steps:
- Extend the hard disk of the appliance (through vSphere Client, PowerCLI or any other mean 🙂 )
- Update your OS informations (with
fdiskcommand line) - Update your mount point (with
resize2fstool)
Curator
Curator is used to purge elasticsearch shards in order to limit data growth. If you have extended hard drive that hosts elasticsearch data, you should update Curator settings as well in order to reflect these changes.
This is done via updating crontab configuration file located at /etc/crontab
# cat /etc/crontab
5 * * * * root curator delete --disk-space 10
You just have to update the parameter --disk-space 10 to specify the limit (in GB) elasticsearch shards should be limited to.
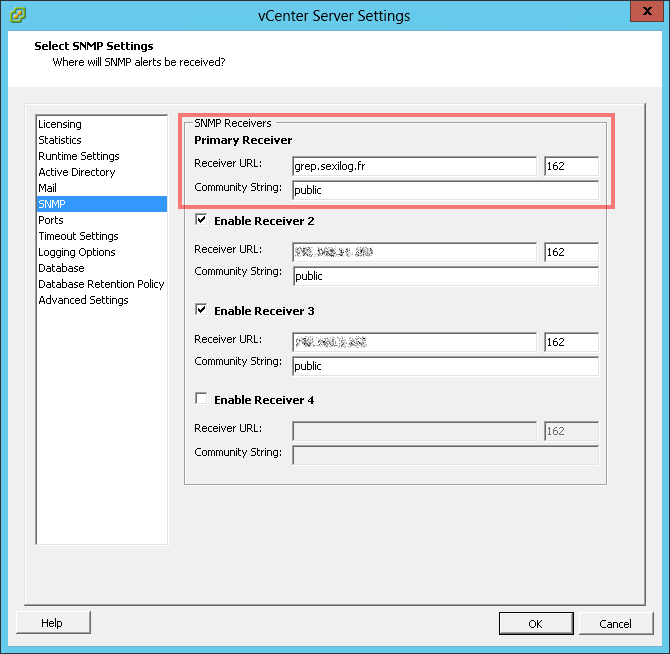
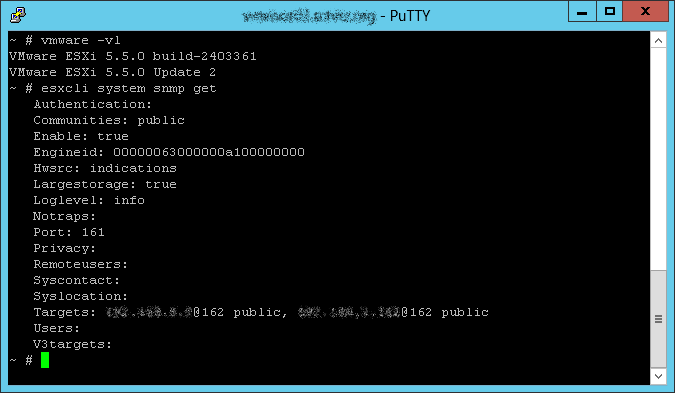
SNMPd
As described in the Features tab, snmptrapd forwards traps to logstash through rsyslog. You can configure Veeam B&R server to send SNMP traps to SexiLog but also ESXi and vCenter:
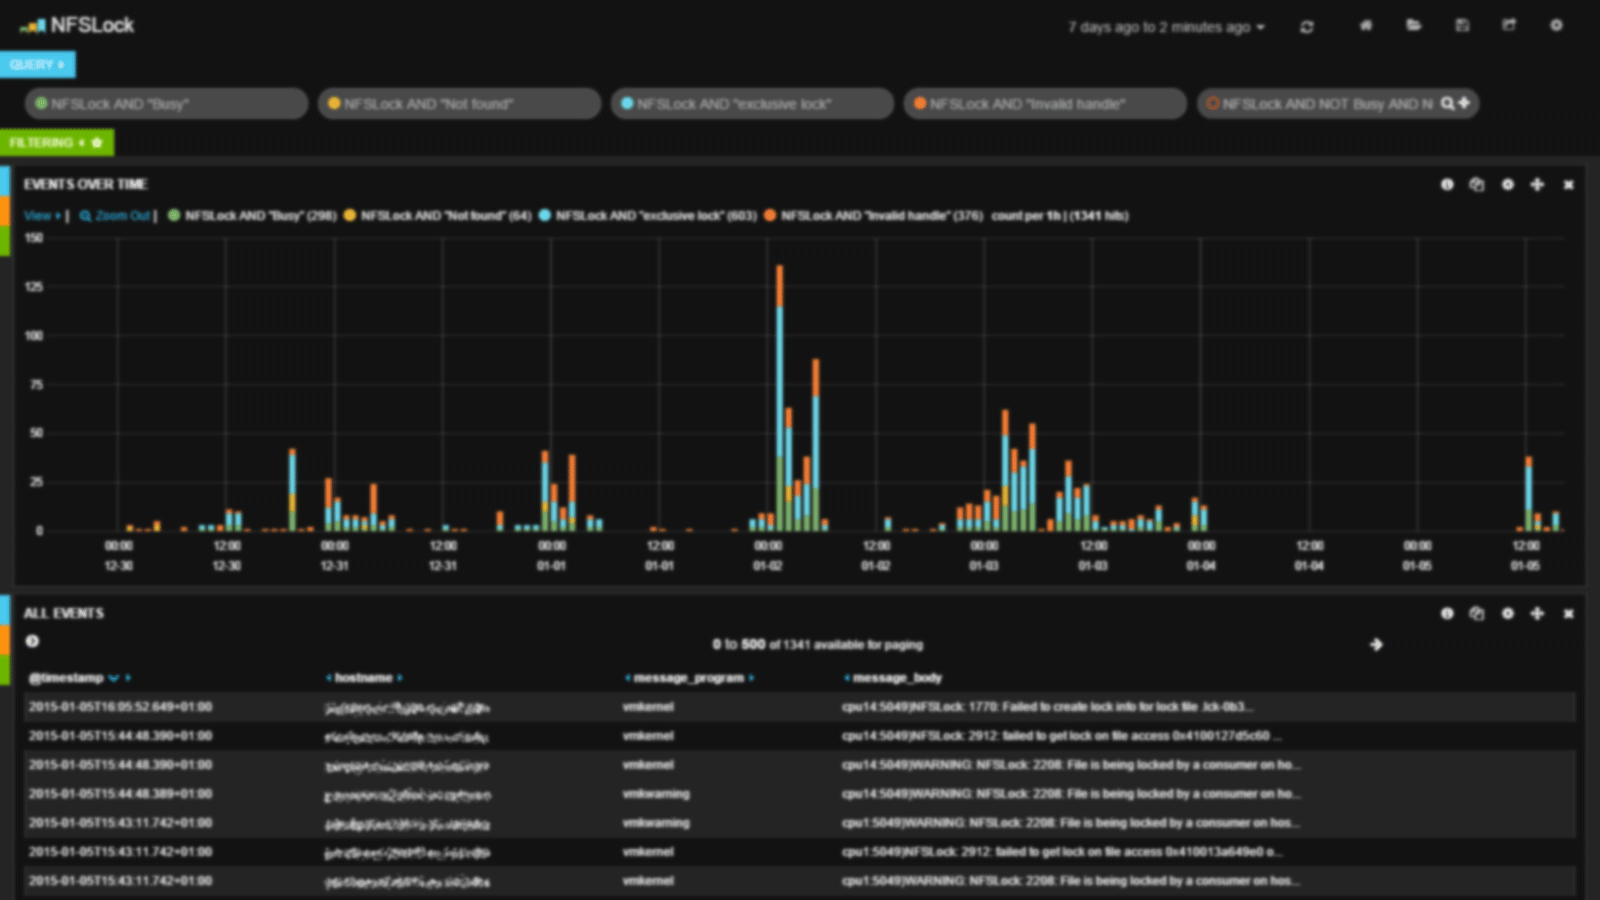
vCenter logs & Windows EventLog
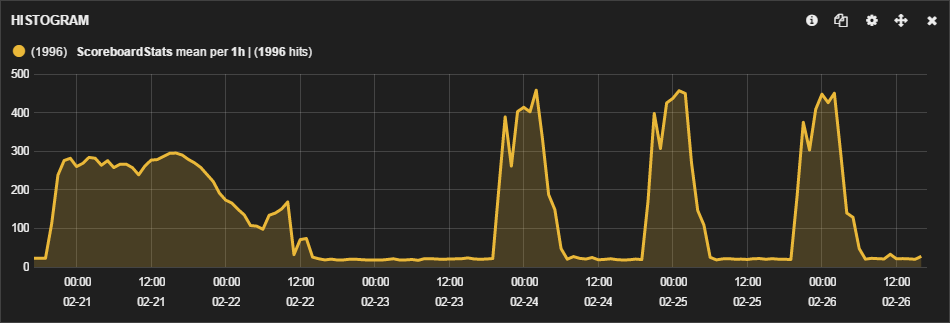
SexiLog is ready to receive Windows vpxd logs (aka vpxd.log) as well as Windows EventLog(s). You simply need to install the small NXLog agent and use the pre-configured configuration file available on the GitHub repository. You’ll need to replace “127.0.0.1” entries in nxlog.conf by the right SexiLog IP or FQDN. Since NXLog will also forward the vpxd-profiler.log file (aka profiled metrics) you’ll get a lot of vCenter metrics like active sessions:
.
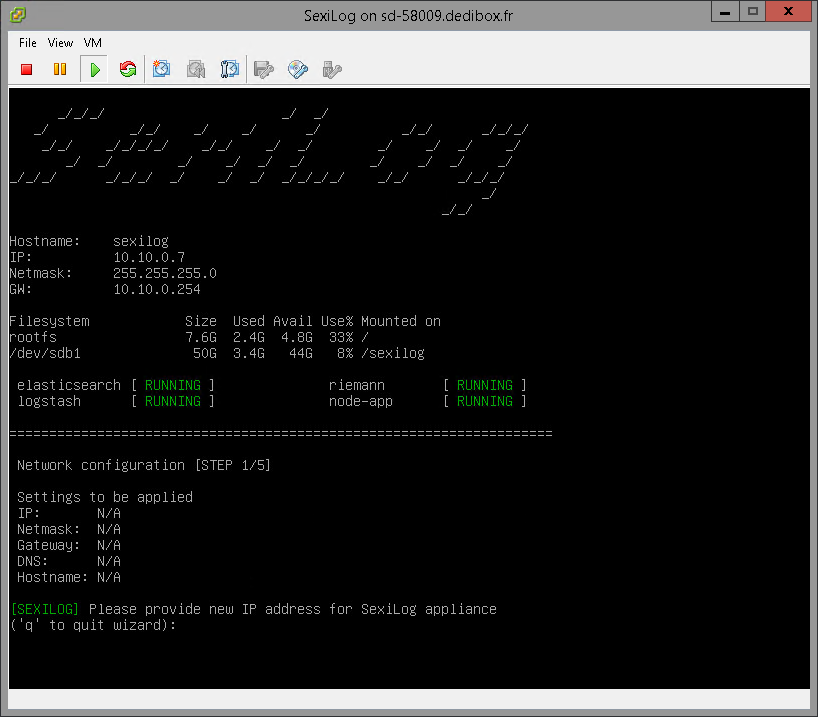
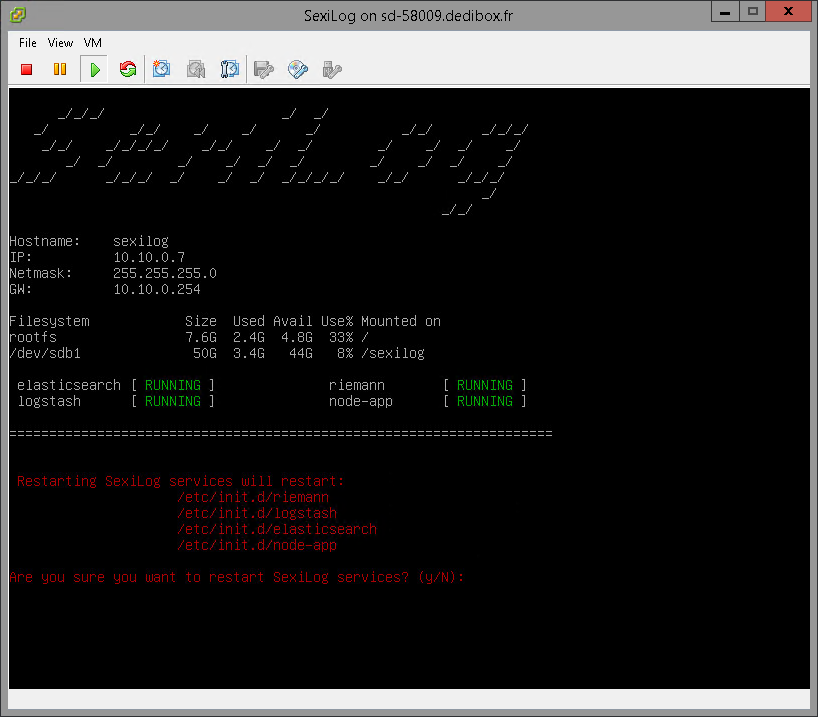
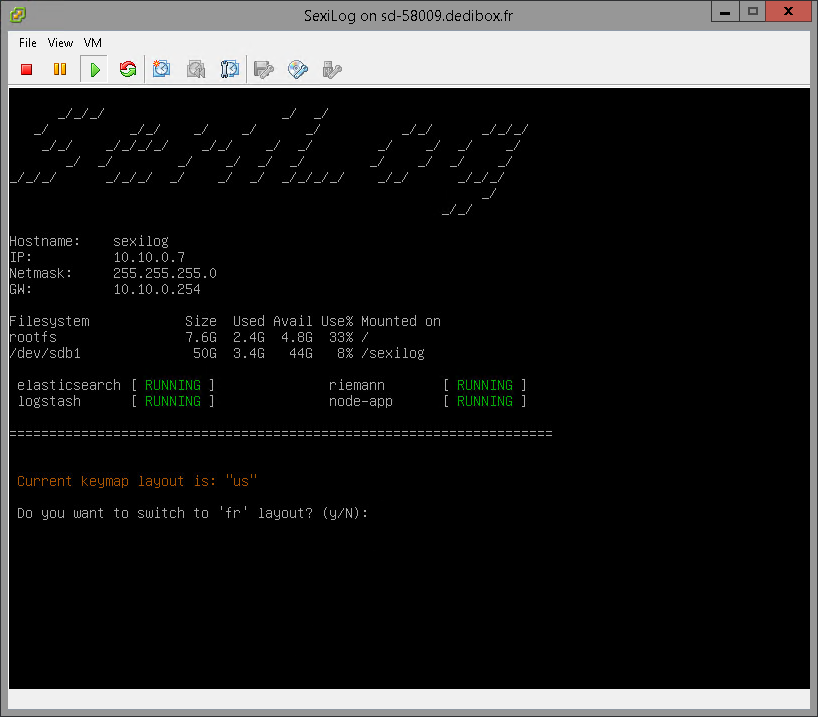
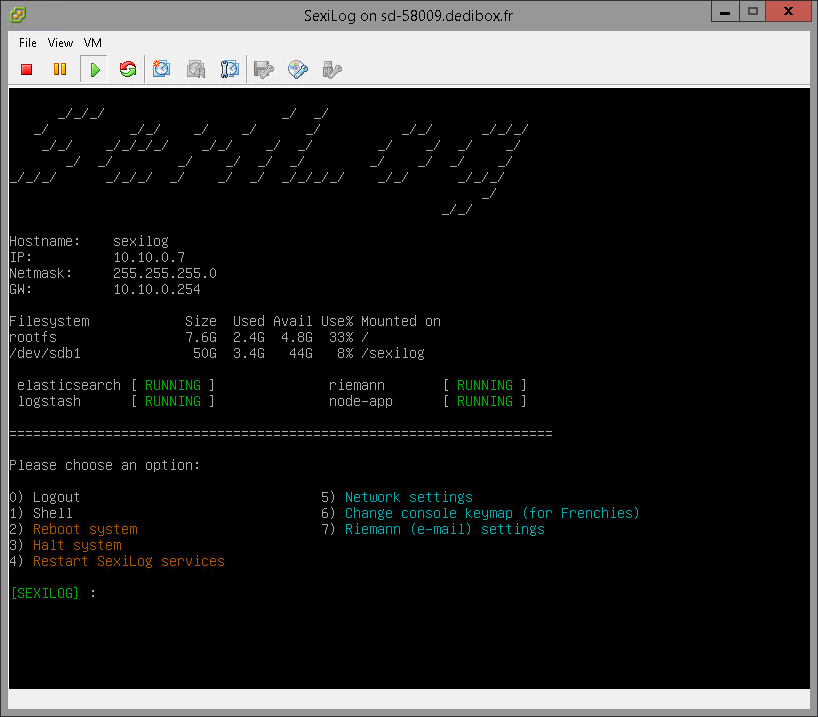
SexiMenu
SexiMenu have been built to make appliance’s common configuration steps easier. It’s automatically launched when connecting to the appliance (through SSH or console) and feature some pre-defined actions like restarting services, or updating network settings.
The main purpose of SexiMenu is to automate all basic operations to avoid manual step (if you want you can still do it manually of course, but we thought about lazy admins 🙂 )
.
Importing dashboard from GiST code in Kibana 3
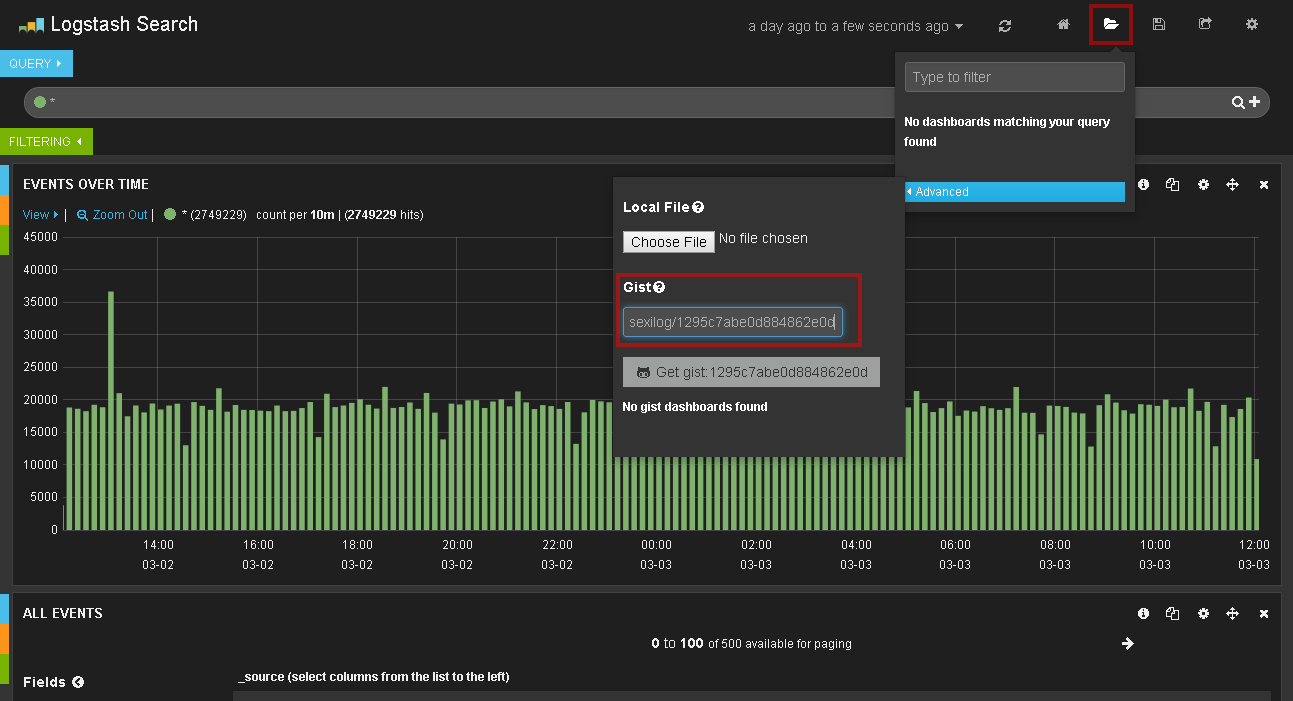
Kibana 3 comes with a built-in dashboard importer, that lets you load additional files for custom views, either from local files, or Gist storage on GitHub. We make all SexiBoards available on our GiST account in order to let you import their definition in just 5 easy steps:
- In Kibana’s toolbar, click the icon, then hover over the Advanced option.
- In Gist number or URL input field, enter the URL of your dashboard Gist (provided on each SexiBoard page).
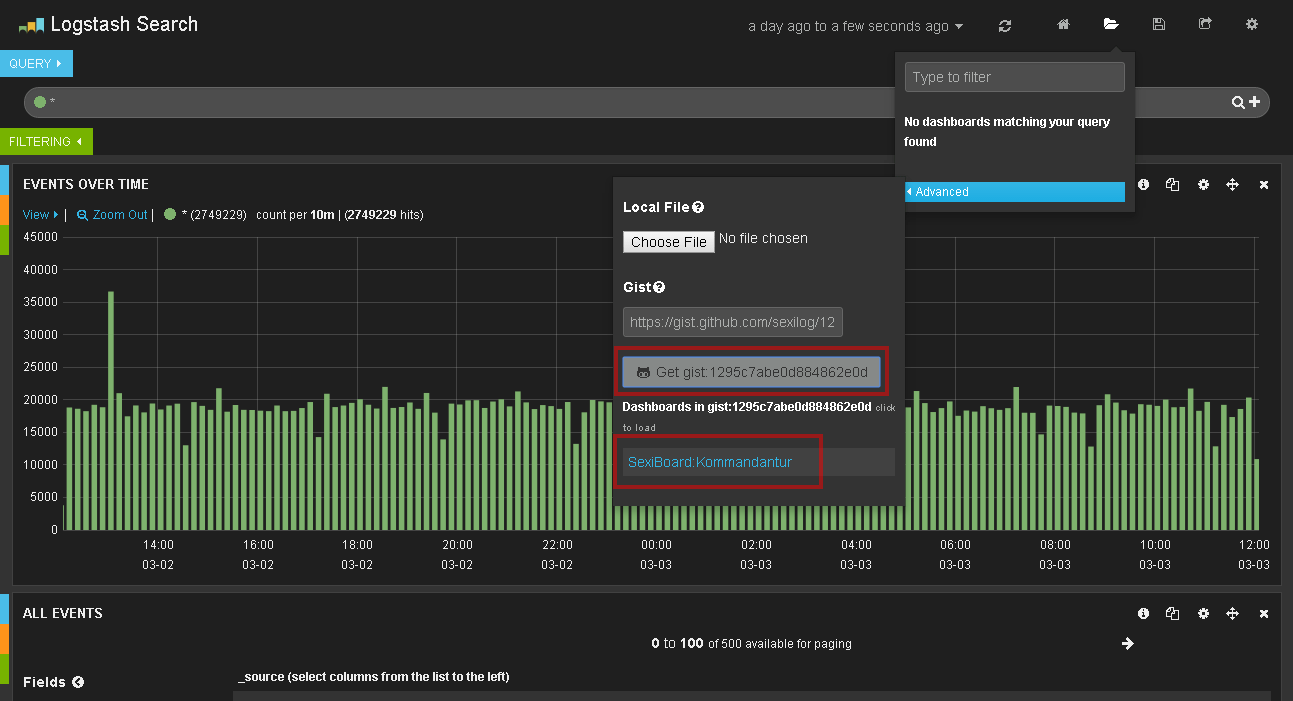
- To open the custom dashboard, click
Get gist:<gist-id>button. - To load the dashboard, click the dashboard name below the Gist ID button.
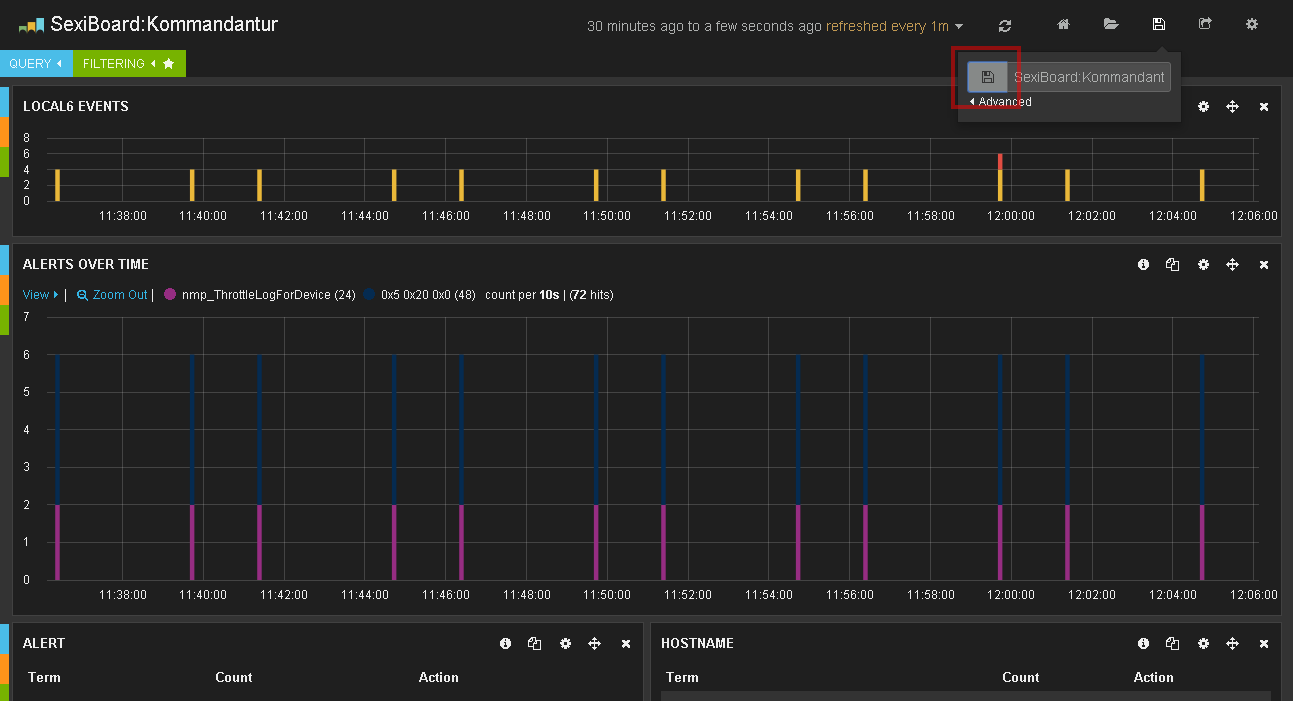
- Save the loaded dashboard by clicking on the icon
Kibana 3 explanation
We thought we should explain why SexiLog is provided with Kibana 3 instead of Kibana 4 (which was released on February 19th).
There are several reasons that explain it, one of the main is that IMHO Kibana 3 is easier to apprehend for most of users. Also Kibana 4 was released as we were working on SexiLog launch, so we didn’t want to postpone it while we redesigned all the dashboards for the new branch (which is a complete redesign from scratch, much better, but very different in conception 🙂 ). We prefered to stay on Kibana 3 branch and release SexiLog for you !
But as Kibana 4 is the new production branch, rest assured that we work now on making new SexiLog update with Kibana 4 dashboards !
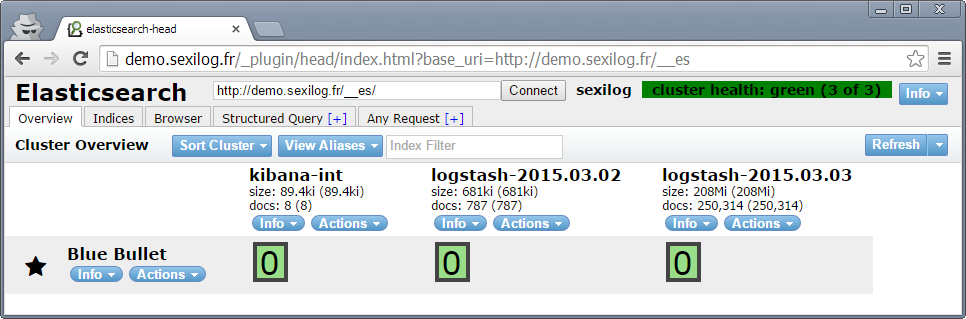
Elasticsearch plugins
Sexilog is loaded with 2 awesome and very useful Elasticsearch plugins Head and Bigdesk.
Go to http://your_appliance_fqdn_or_ipv4/_plugin/head and http://your_appliance_fqdn_or_ipv4/_plugin/bigdesk or try the demo.
3 comments for “#RTFM”