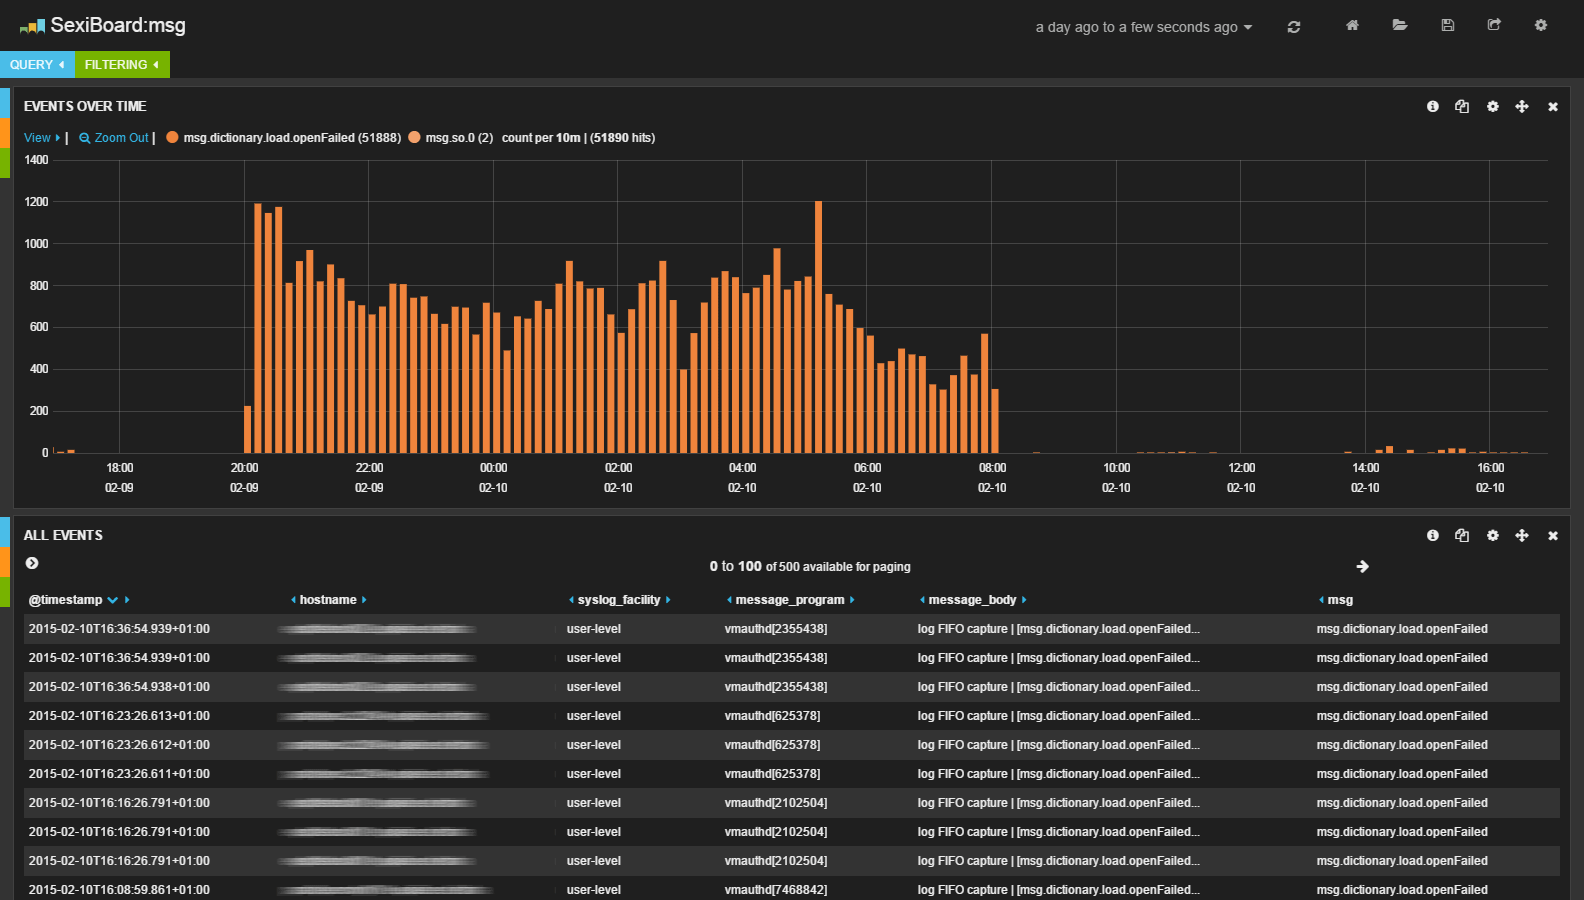
The msg dashboard is a simple Kibana topN query on the msg field. This field is created everytime logstash see something like “msg.something.happens“.
This dashboard allow you to catch errors like msg.uuid.altered, msg.checkpoint.migration.nodata, msg.svgaUI.badLimits, msg.checkpoint.migration.maxSwitchoverTimeExceeded, msg.vmk.status.VMK_TIMEOUT or msg.vmotion.connect.failure.
.
This dashboard is embedded in SexiLog. If you want up-to-date version for your own platform, the Gist code for this dashboard is:
https://gist.github.com/sexibytes/304d615528fe7bb780ceMore information about dashboard import in Kibana is available here