This dashboard is aimed at keeping track of SQL response time from a vCenter point of view. A healthy database backend is a must for vCenter Server, as a lot of thing is done in db.
SQL execution times are extended and take a long time to complete.
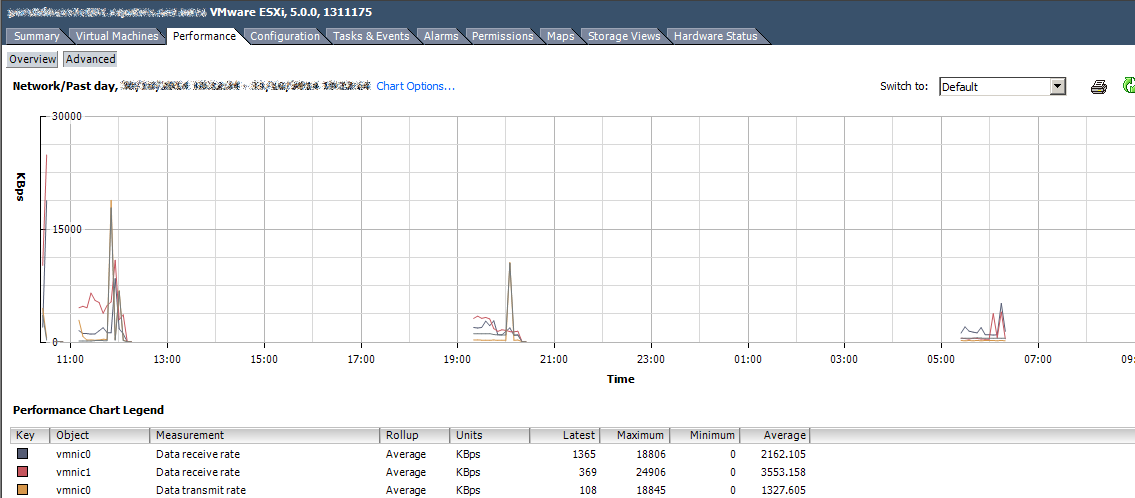
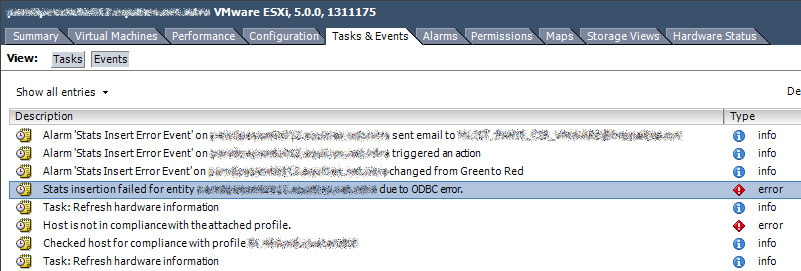
If you have performance issue with your db server, there will be a lot of nasty outcome in your vCenter, such as failure of stats collection, gaps in performance charts, tasks queuing up, …
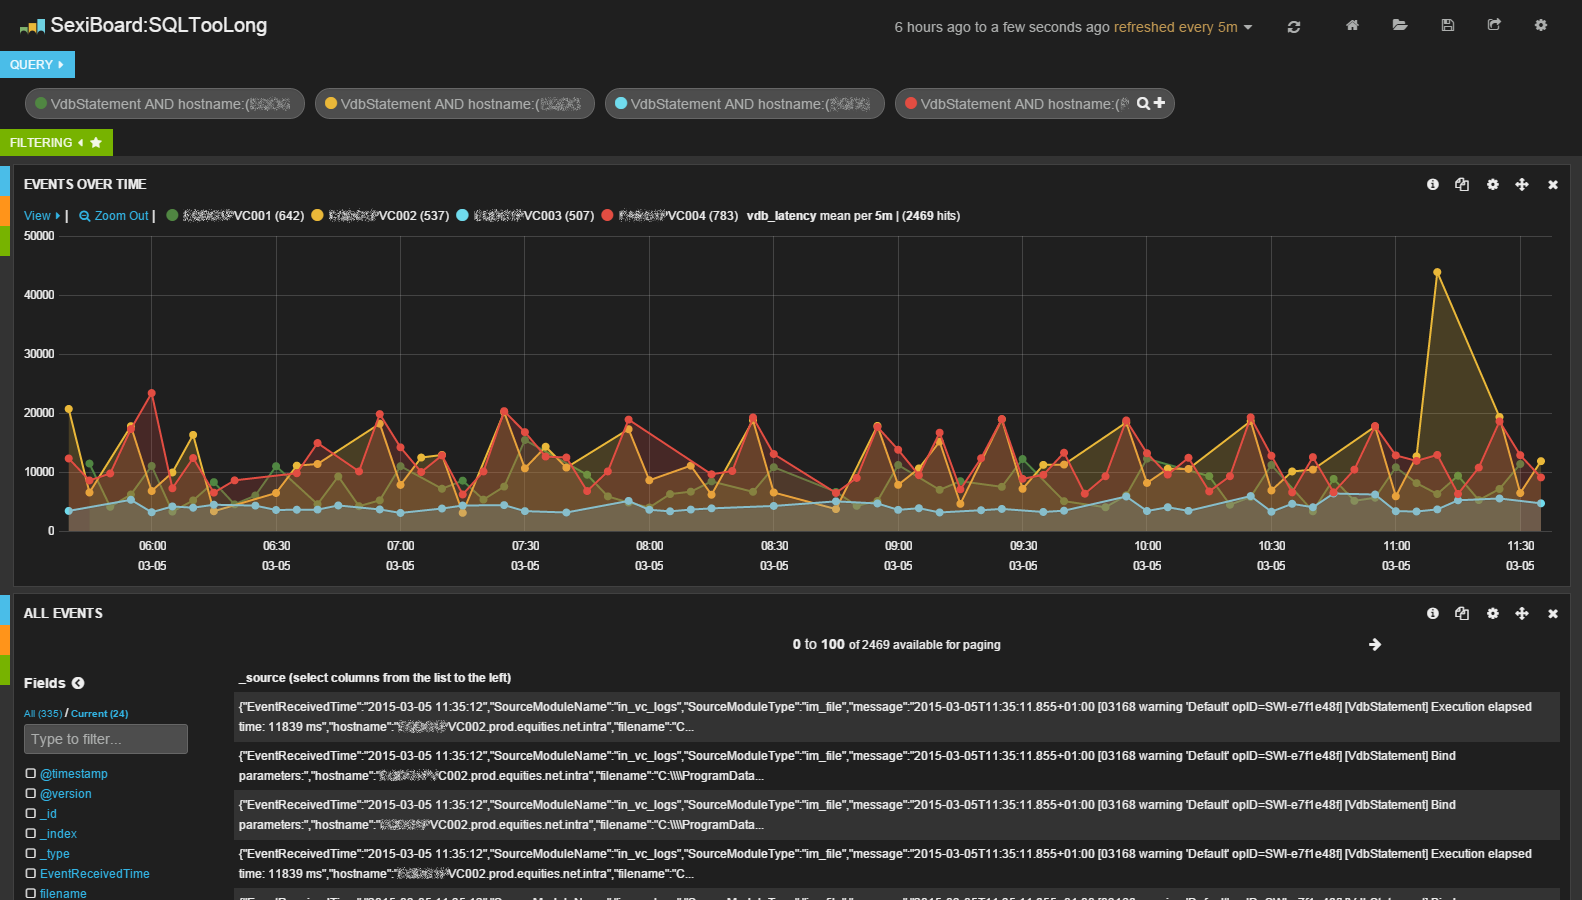
If there is some issue on vcd side, you will see on vpxd.log files some statement about it:
2015-03-06T10:50:06.207+01:00 [05384 warning 'Default' opID=SWI-7c33d20] [VdbStatement] Execution elapsed time: 6189 ms
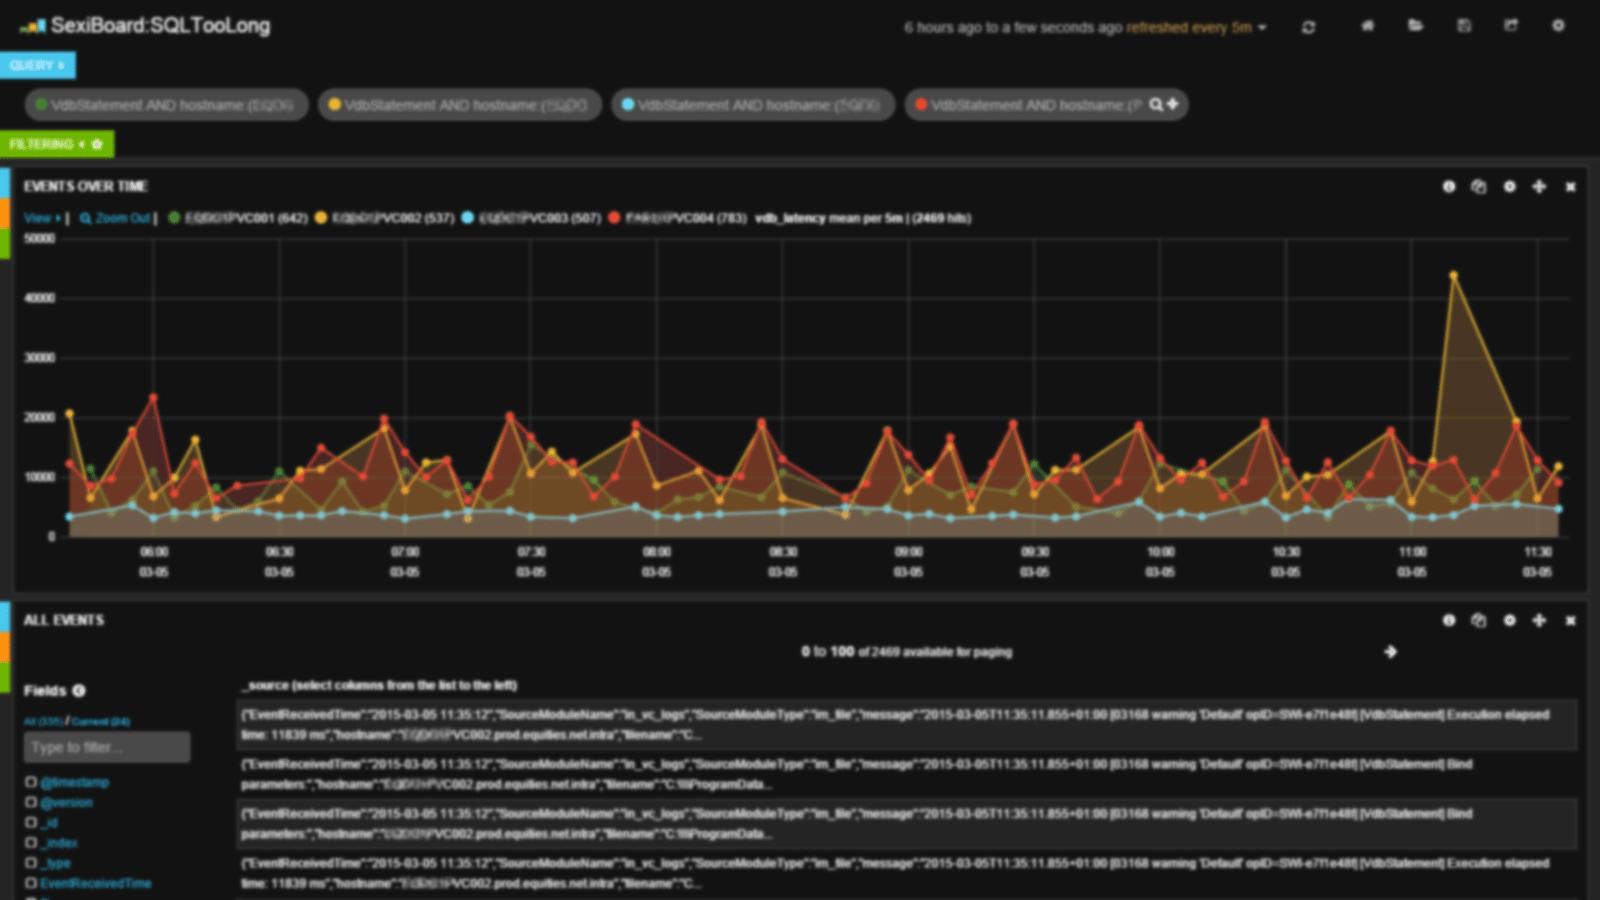
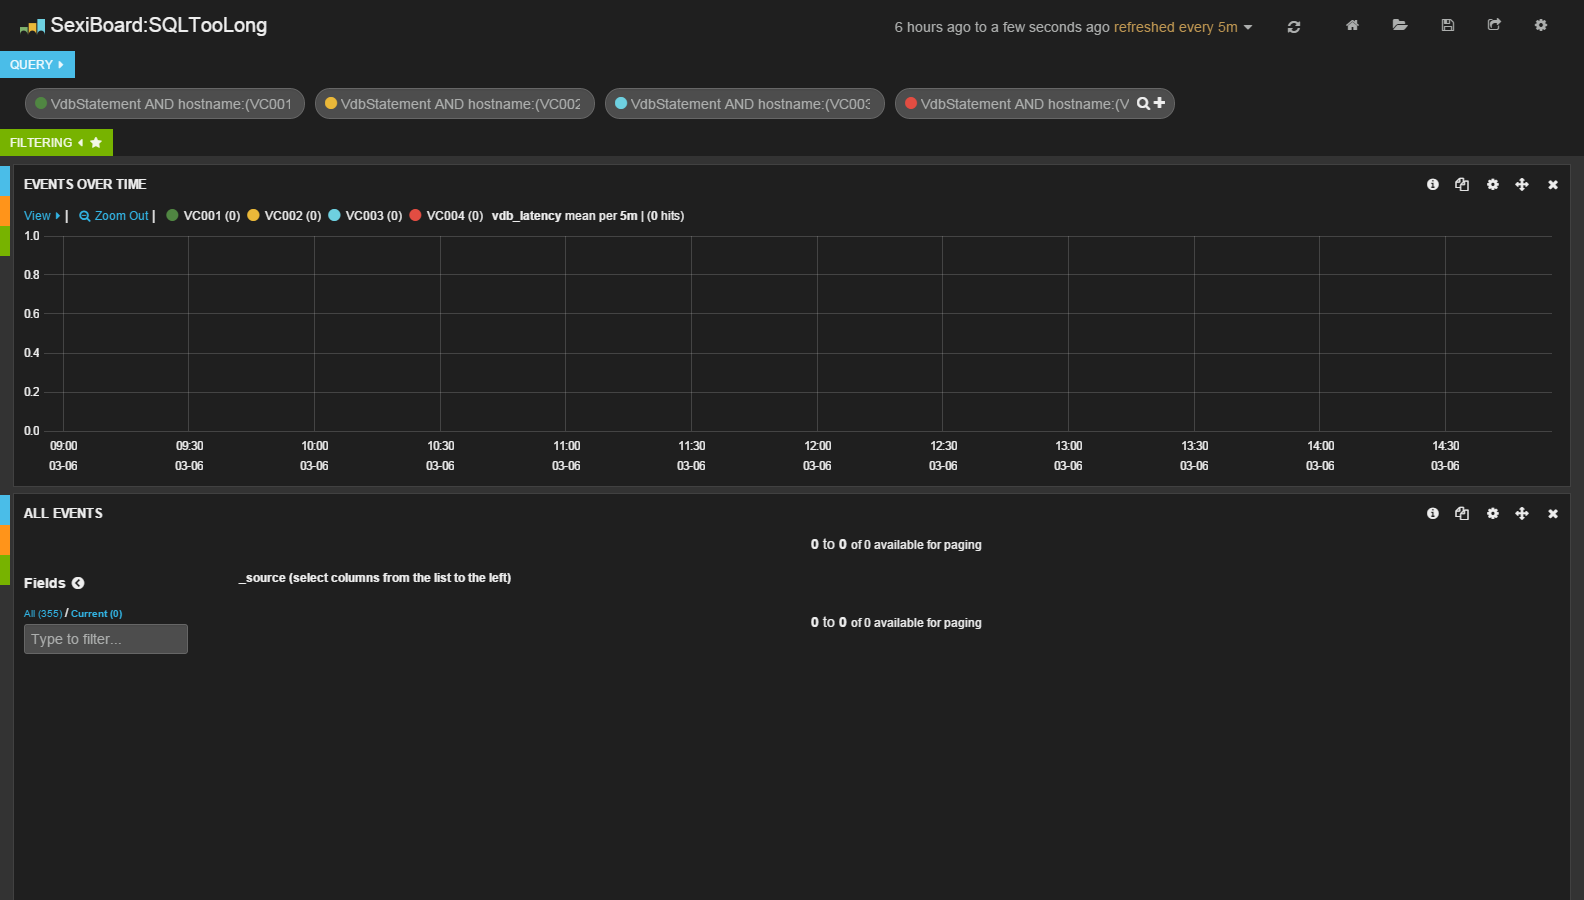
The SQLTooLong dashboard will display database latency based on the vdb_latency field for every configured vCenter you have.
The golden rule for this dashboard is the lower, the better! If you have some unexpected high values (depending on your environment) ⇒ go check on your DBA team 🙂
This dashboard is actually a template and needs a bit of configuration. You need to replace the vCenter names by yours. Don’t hesitate to add some query fields to split them up if you have a lot of vCenter.
Associated VMware KB articles:
https://gist.github.com/sexibytes/522cff646e64ea8dd16a