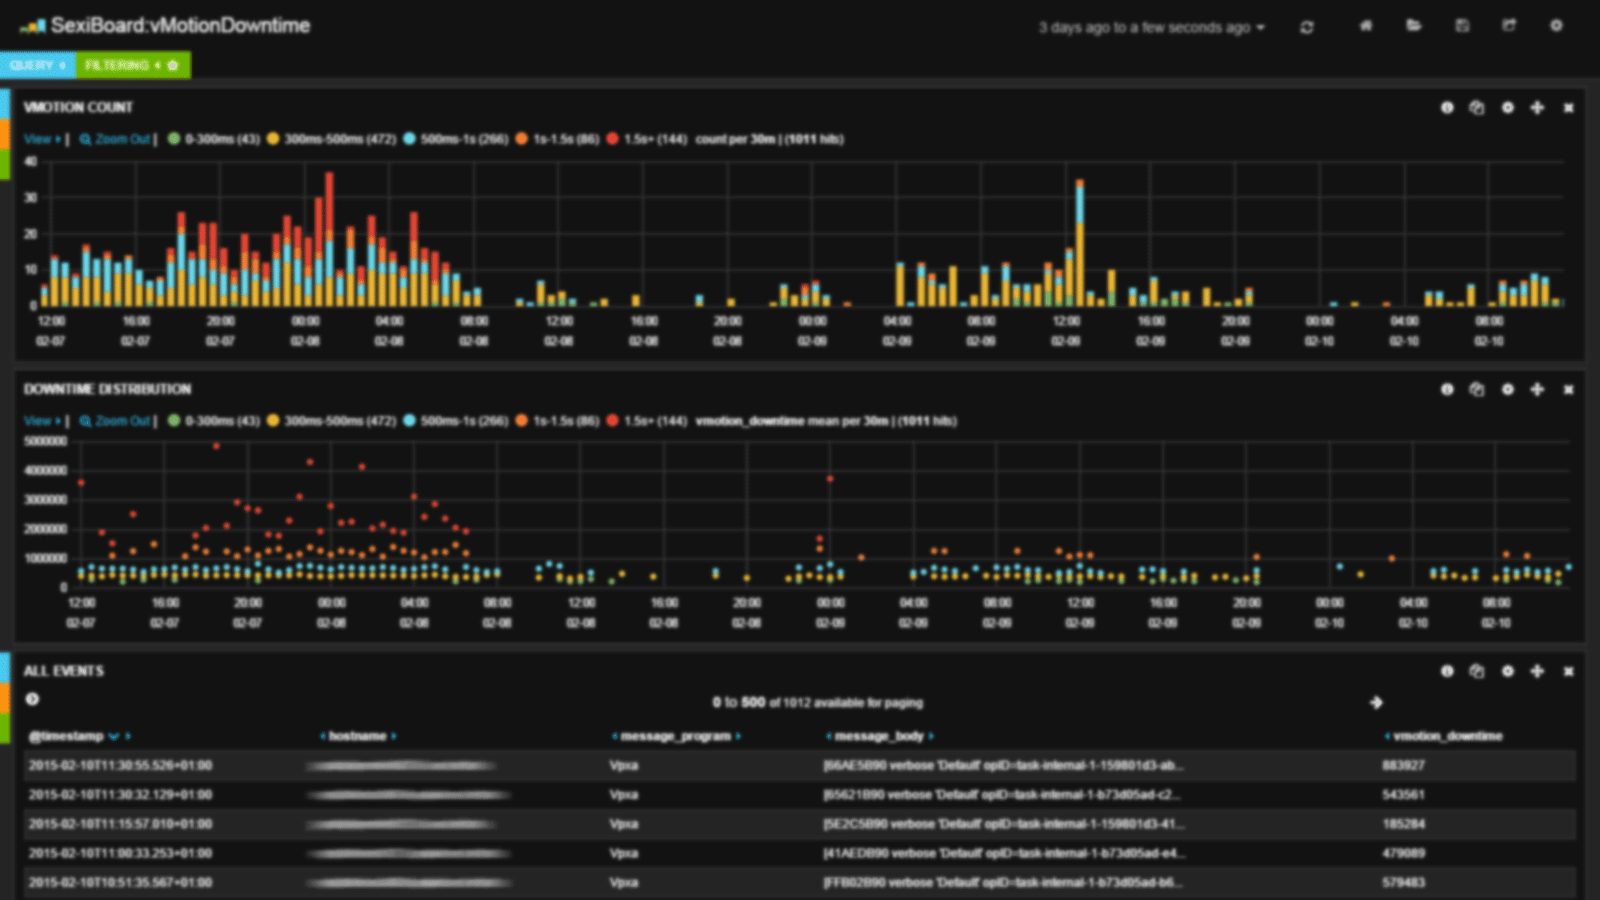
The LogicalSession dashboard leverage one of the vpxd-profiler statistic counters logged in vpxd-profiler.log file.
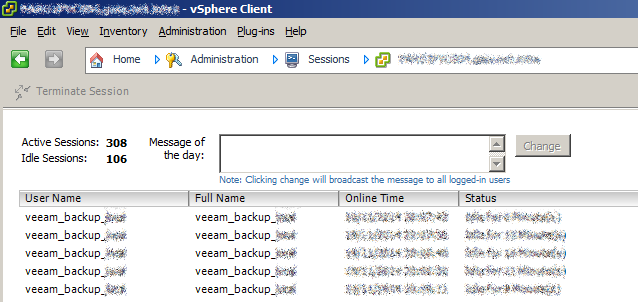
The Vpxd::Session::LogicalSession counter helps you track the vCenter server active & idle connexions limited by the maxSessionCount vpxd.cfg parameter.
In the following screenshot you can observe vCenter connections during backup window. This dashboard actually helped troubleshooting a real backup jobs scheduling issue as the default maximum session count was reached sometimes.
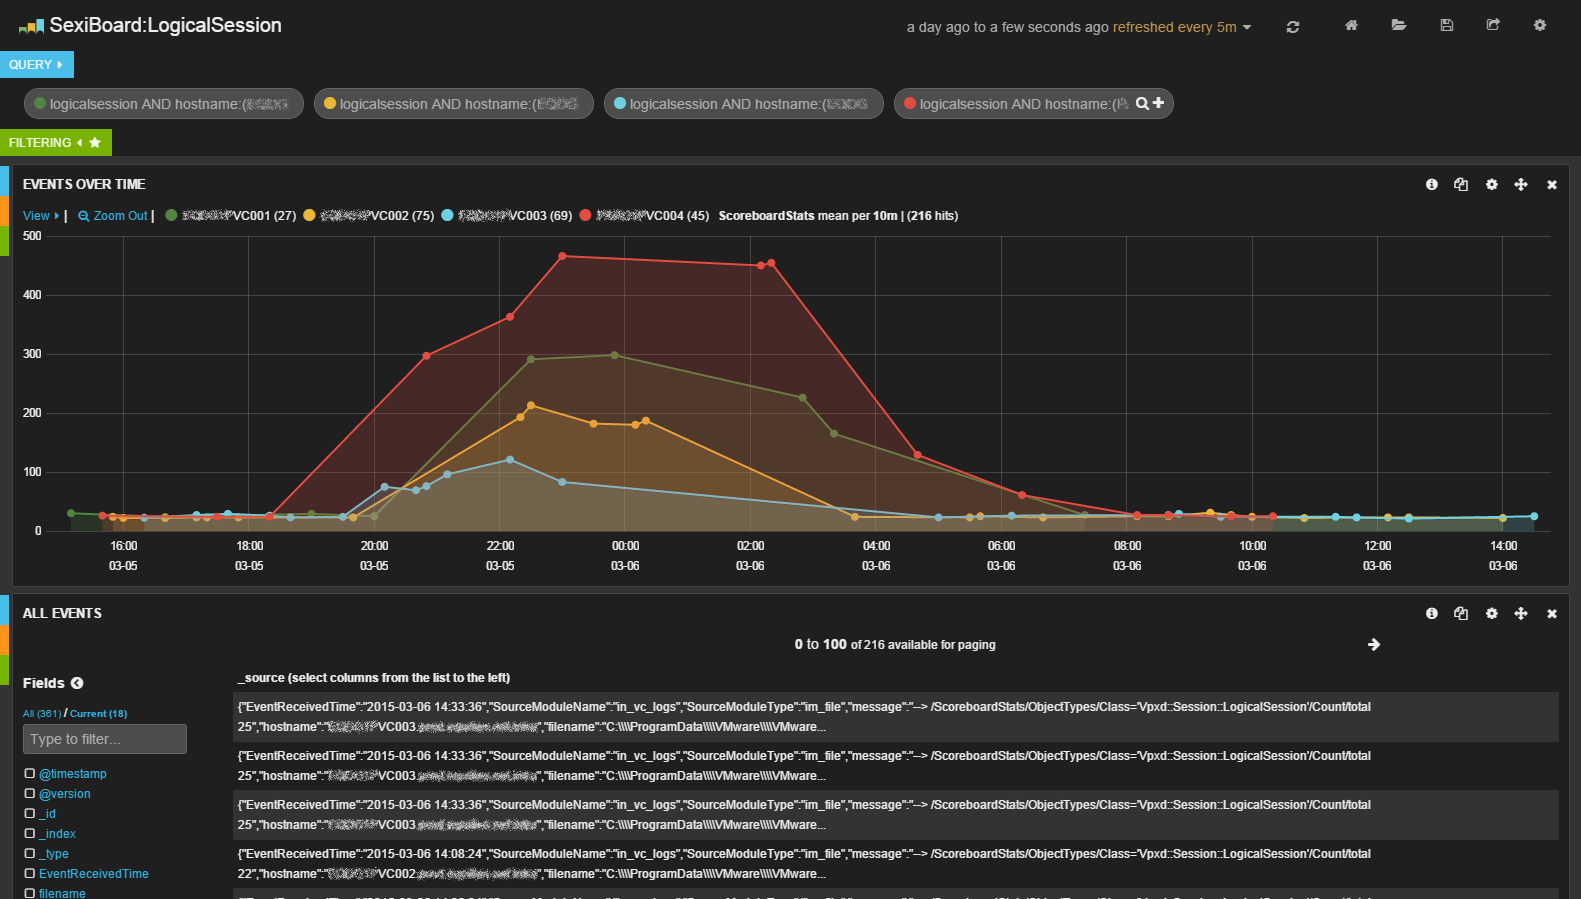
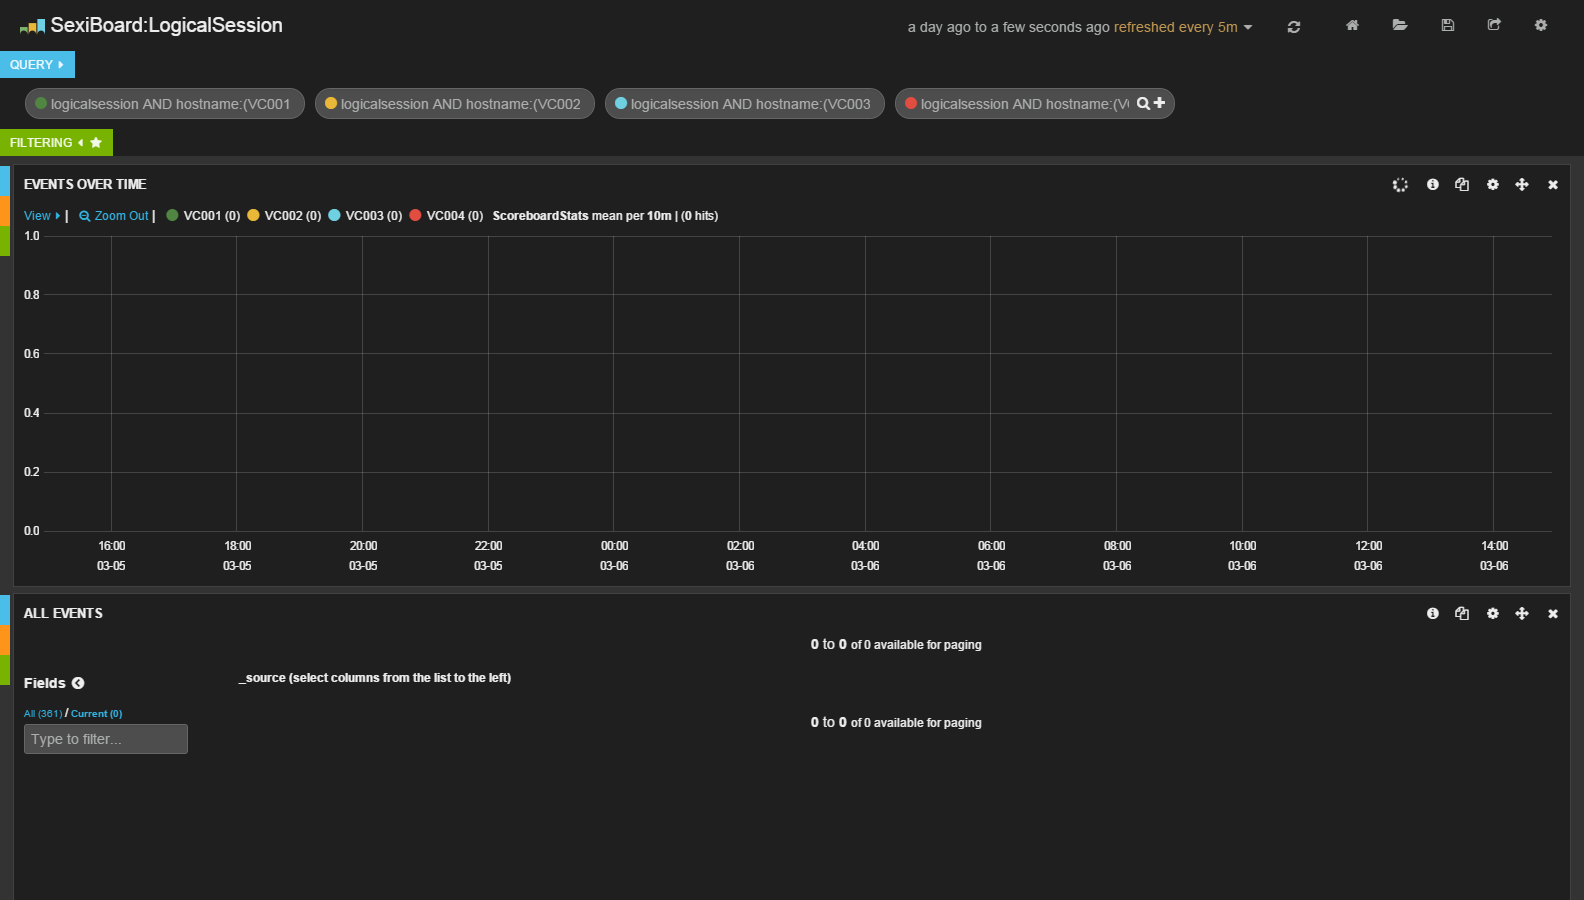
This dashboard is actually a template and needs a bit of configuration. You need to replace the vCenter names by yours.
This is a vCenter dashboard, you need to configure vpxd.log shipping first
This dashboard is embedded in SexiLog. If you want up-to-date version for your own platform, the Gist code for this dashboard is:
https://gist.github.com/sexibytes/f19810766d1780e7d435 More information about dashboard import in Kibana is available here