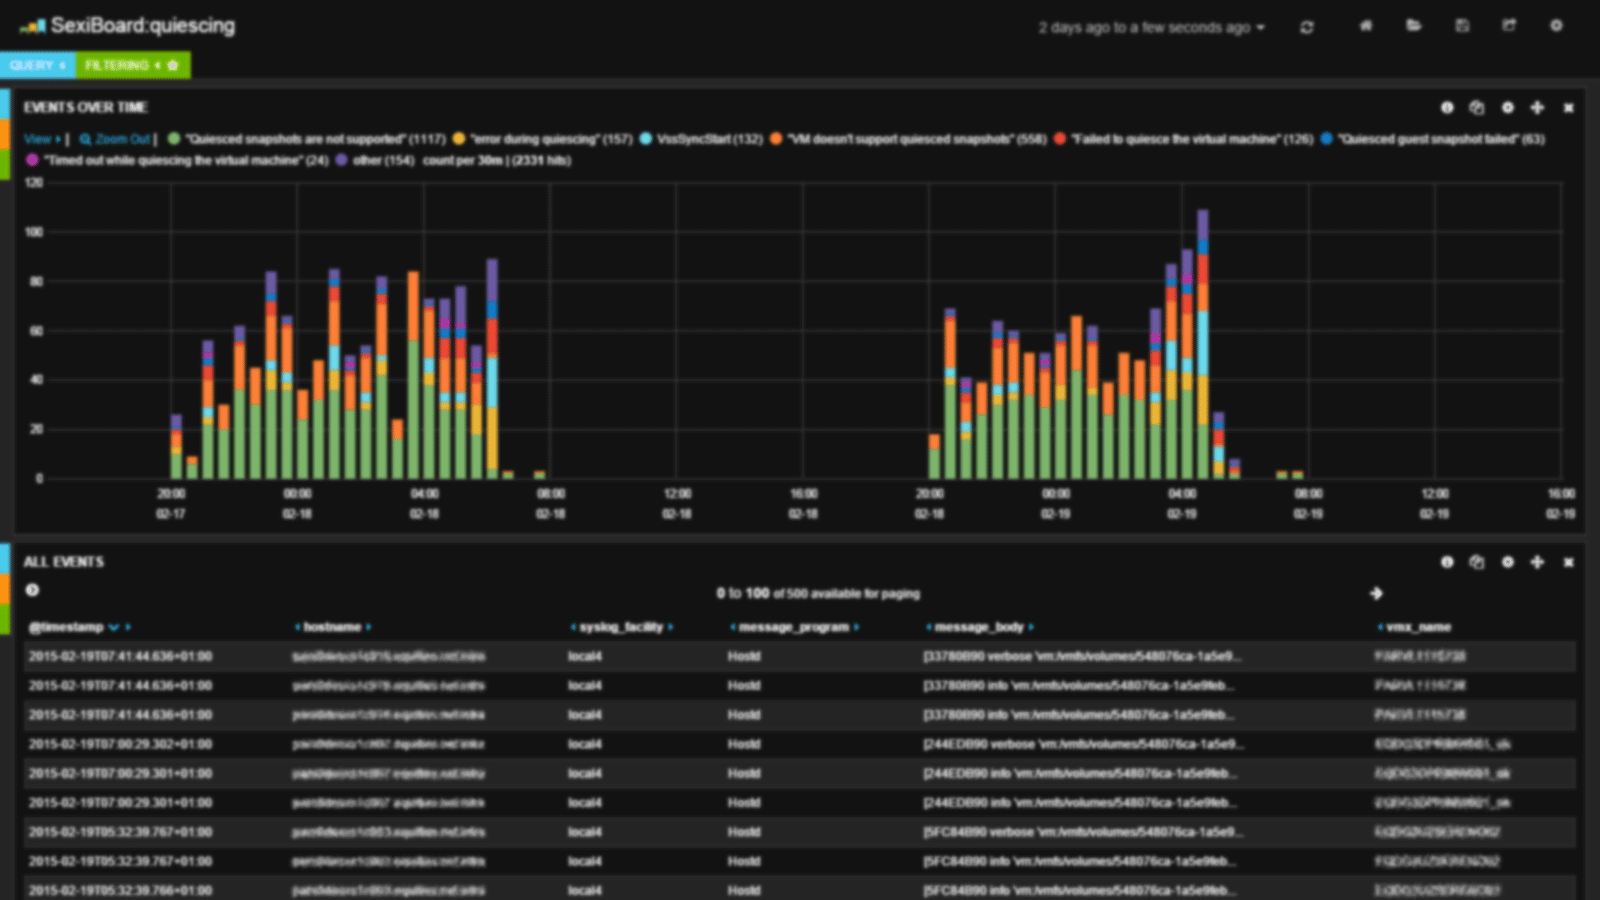
During the vMotion hot migration process, the moved VM is quiesced/stunned very shortly for multiple steps (pre-copy, vmdk closing/opening, etc…). At the end, the global downtime (in µs) is reported in ESXi logs (the vpx.vpxa.config.log.level advanced settings must be set to verbose at least to log vmotion downtime):
.
<166>2015-01-21T14:19:52.163Z esx.domain Vpxa: [355FBB90 verbose 'Default' opID=task-internal-1-19c63550-49-6c-4c-cb-b9-fb] [MIGRATE] (1421849981469328) vmotion result has downtime value 467364
.
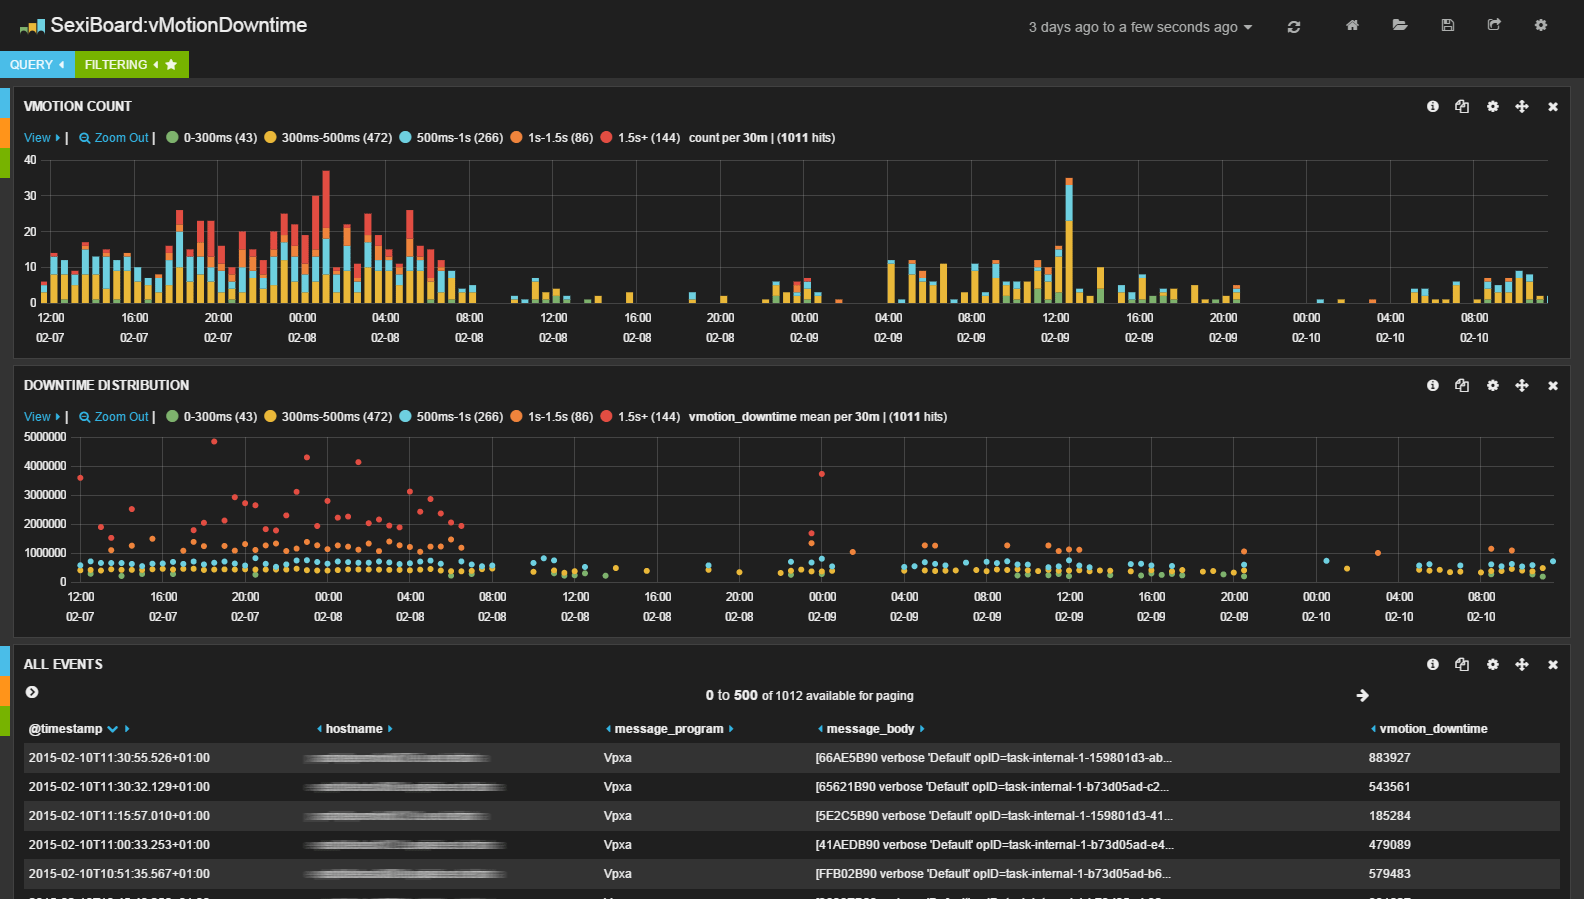
The vMotionDowntime dashboard helps you visualize if the vMotion downtimes are bellow or above 500ms. The first histogram shows the vmotion count and the second histogram shows the downtime values distribution.
Here is the Elasticsearch queries with their respective color in Kibana:
- vmotion_downtime:[0 TO 300000]
- vmotion_downtime:[300000 TO 500000]
- vmotion_downtime:[500000 TO 1000000]
- vmotion_downtime:[1000000 TO 1500000]
- vmotion_downtime:[1500000 TO *]
This dashboard is embedded in SexiLog. If you want up-to-date version for your own platform, the Gist code for this dashboard is:
https://gist.github.com/sexibytes/4bbfa4bf30c07451d7cbMore information about dashboard import in Kibana is available here