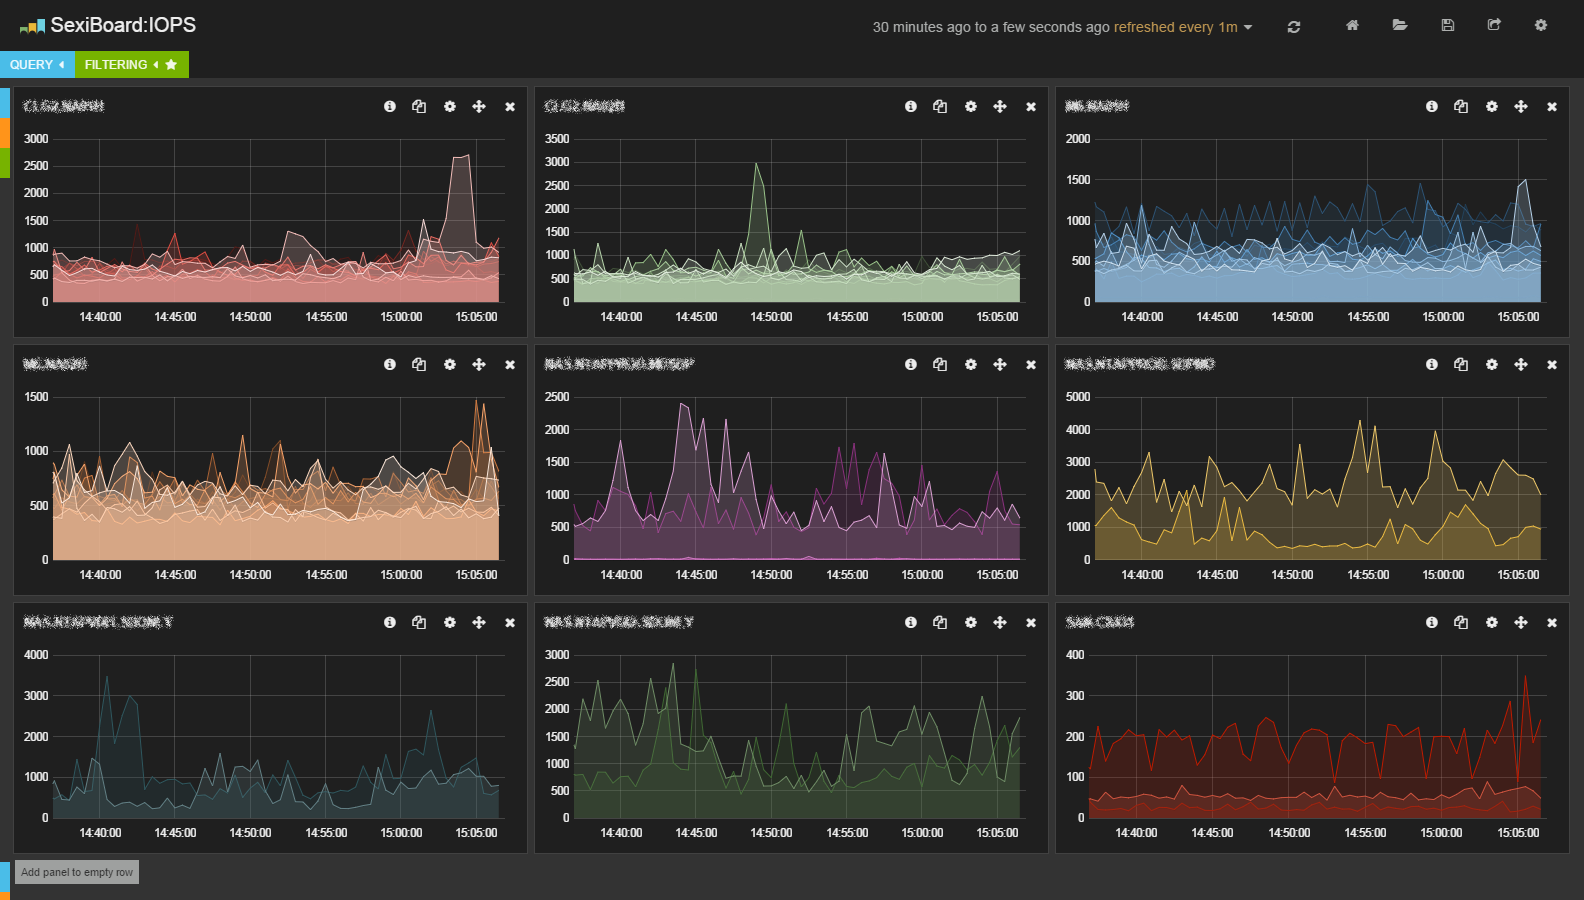
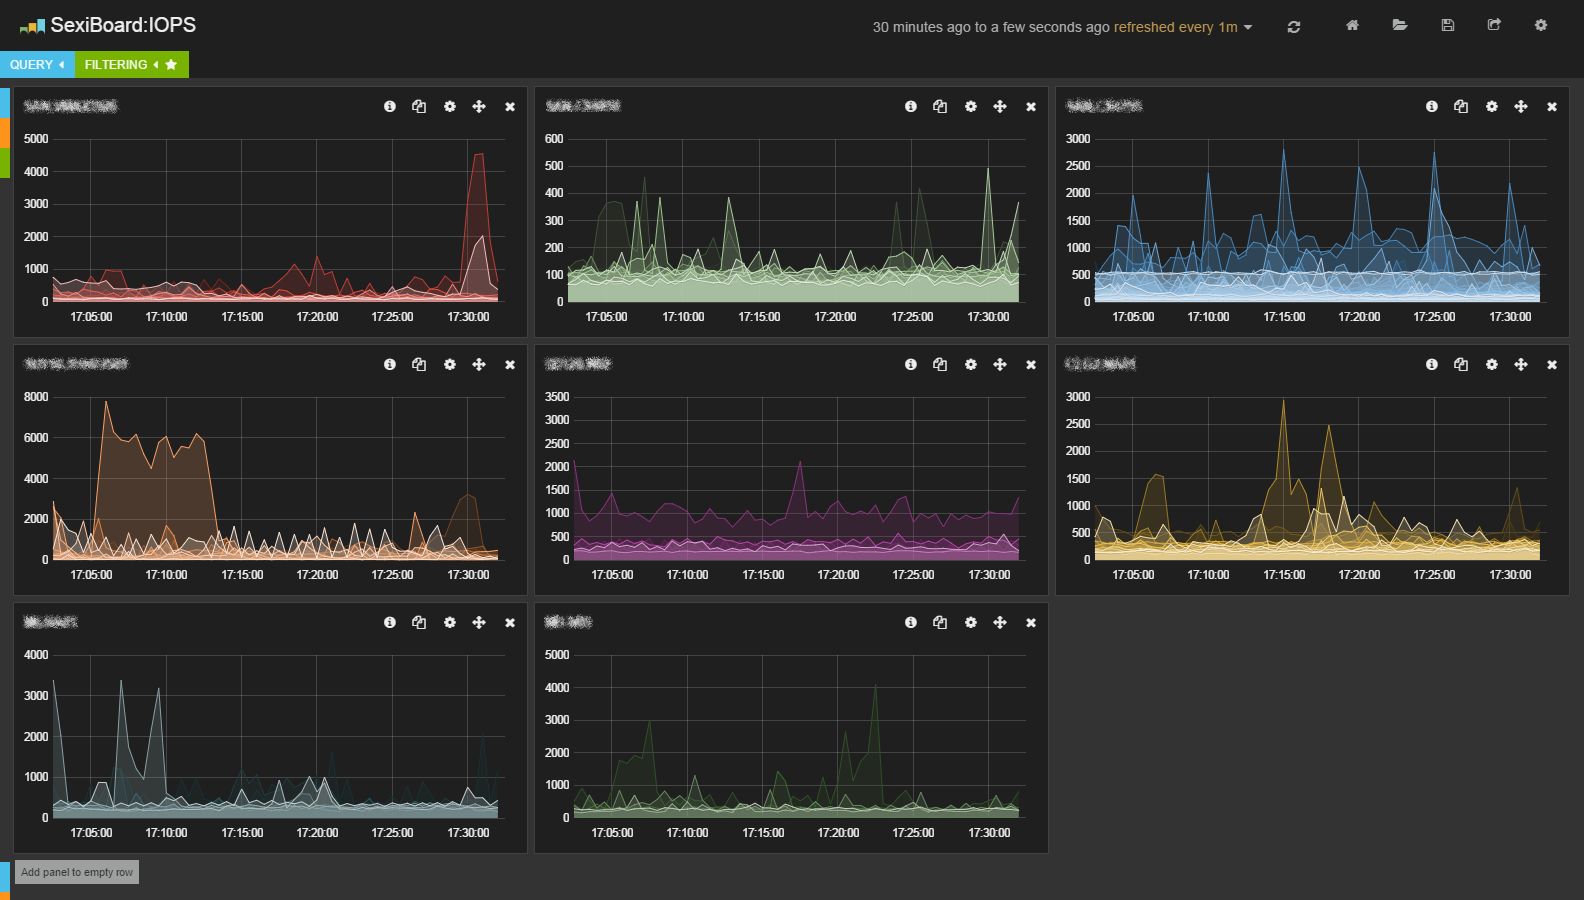
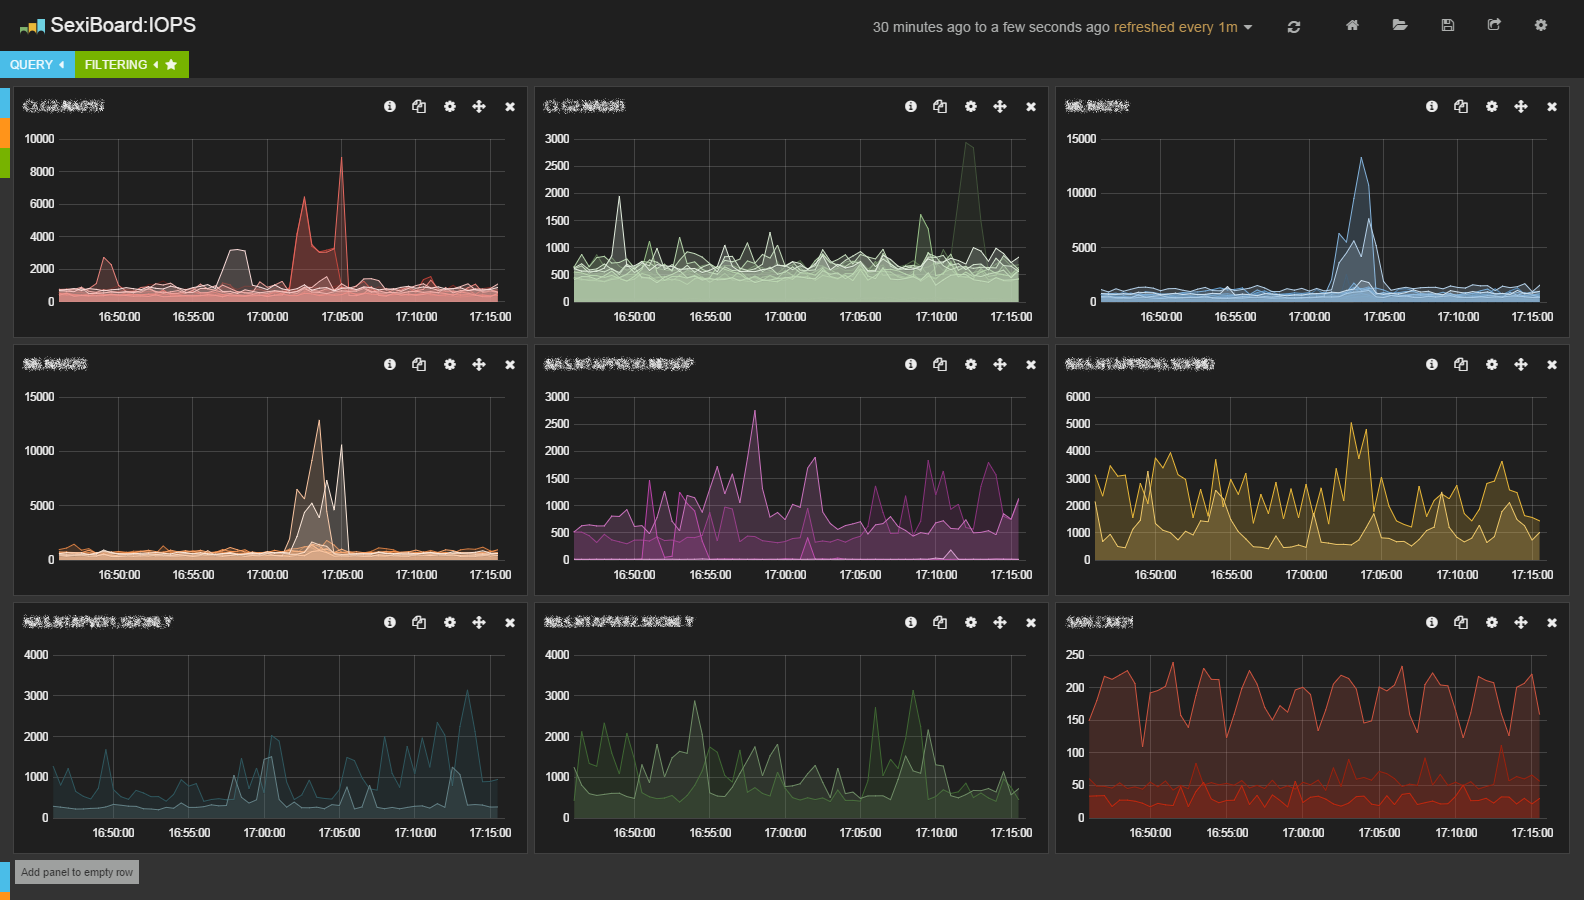
The IOPS dashboard is designed to let you have a quick look on the SIOC (aka Storage I/O Control) IOPS metric of your datastores. This dashboard is of course higly related to the IORM SexiBoard that provide latency metrics.
Like the datastore latency metric, having high IOPS activity could impact your storage performances.
.
.
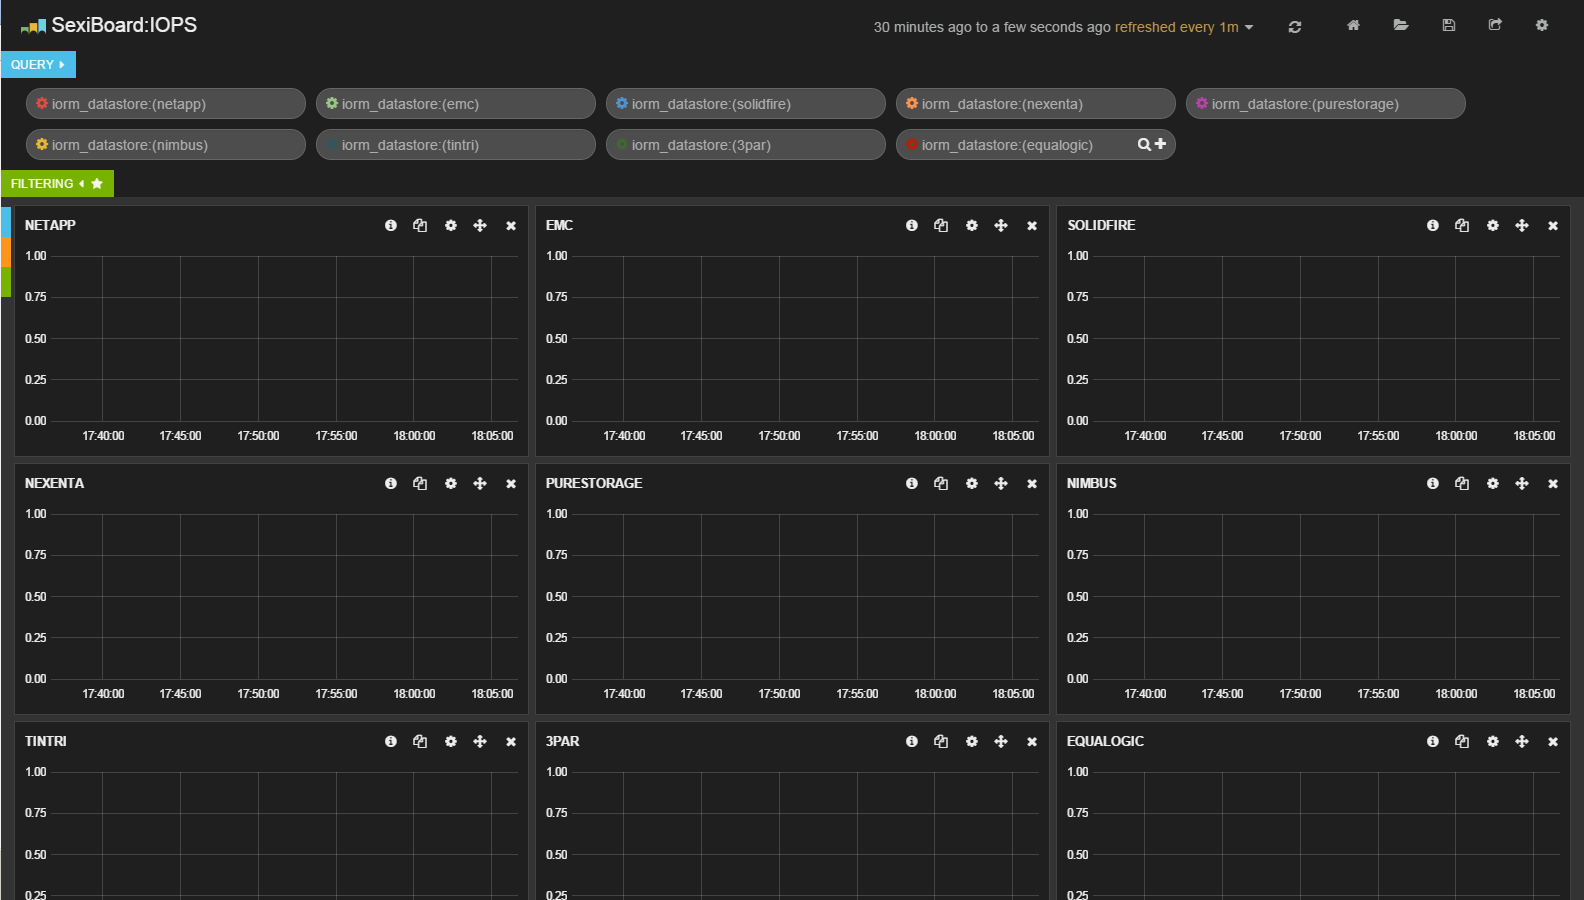
This dashboard is actually a template and needs a bit of configuration. You first need to enable SIOC logging on your ESXi servers and then replace the storage vendors names by your datastore ones in the queries. Since this dashboard is meant to display datastore IOPS per storage controller/array, you can use paterns like san.vmax.* or nas.netapp.* or any leading caracters you’re using to manage your datastores.
.
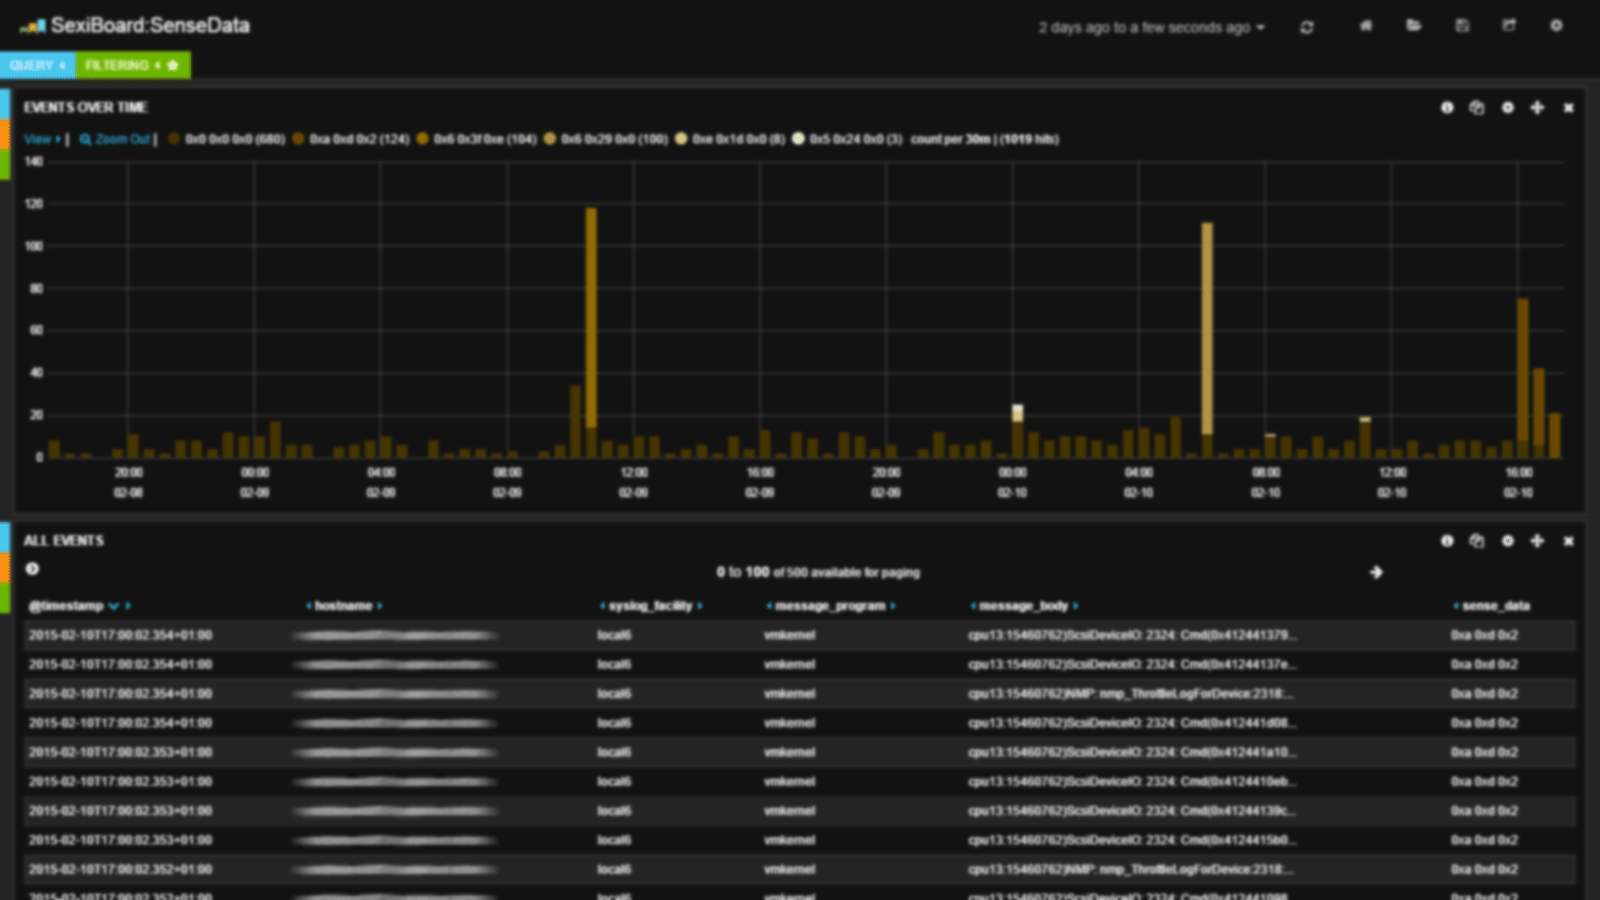
2014-12-10T18:33:04.910Z esx.vmware.com storageRM: 2707630 avglatency= 0.83 iops= 84 threshold= 30 Win = 30.00 ws= 30 devqdepth= 30 iocount= 4 noio= 0.00 coio= 0.05
This dashboard is embedded in SexiLog. If you want up-to-date version for your own platform, the Gist code for this dashboard is:
https://gist.github.com/sexibytes/2625fe2a74234b3bda5cMore information about dashboard import in Kibana is available here