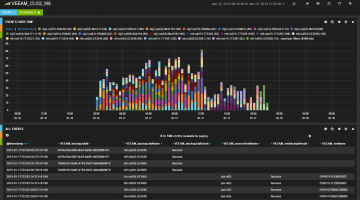
During a mini VSAN outage (disk full), we collected some critical logs and made a quick…
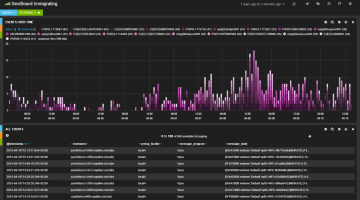
Immigrating
The Immigrating dashboard let you visualize the top 20 most frequently migrated VM the last 7 days (manual,…
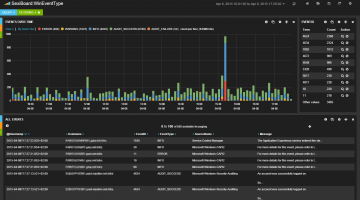
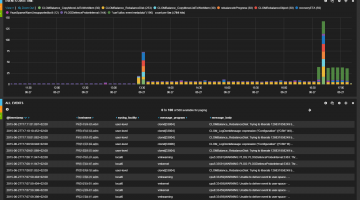
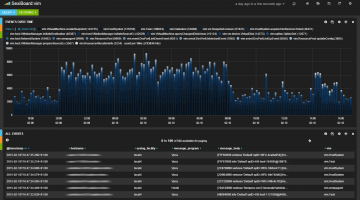
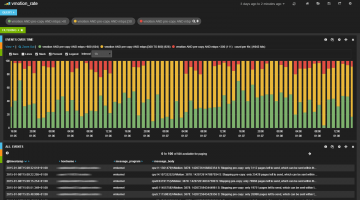
WinEventType
The WinEventType dashboard gives you a quick look over the Windows EventLog types repartition over time.…
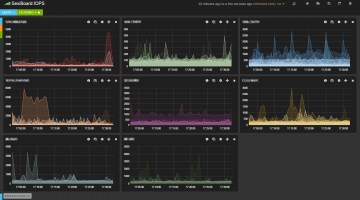
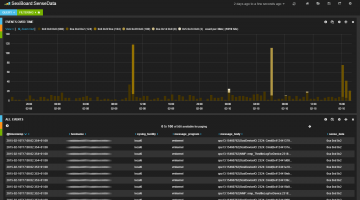
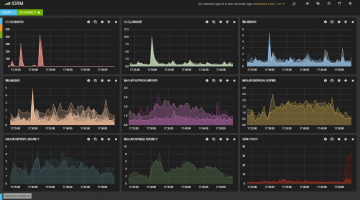
IOPS
The IOPS dashboard is designed to let you have a quick look on the SIOC (aka Storage I/O…
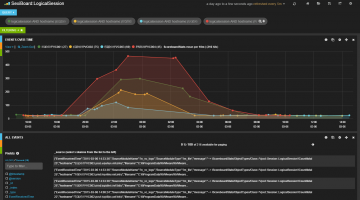
ScoreboardStats Logical Session
The LogicalSession dashboard leverage one of the vpxd-profiler statistic counters logged in vpxd-profiler.log file. The Vpxd::Session::LogicalSession counter…
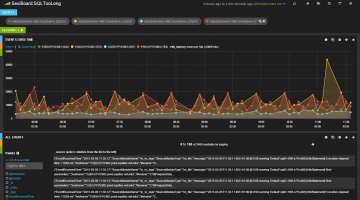
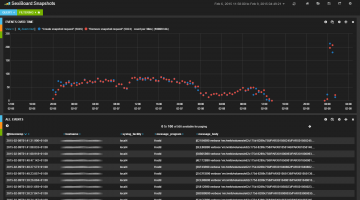
SQL execution took too long
This dashboard is aimed at keeping track of SQL response time from a vCenter point…
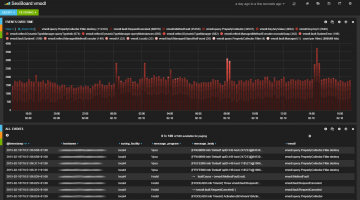
vmodl.*
VMODL stands for VMware Managed Object Design Language. The vmodl dashboard is a simple Kibana topN query…
vim.*
VIM stands for Virtual Infrastructure Methodology, the RESTful API of vSphere. The vim dashboard is a simple Kibana…
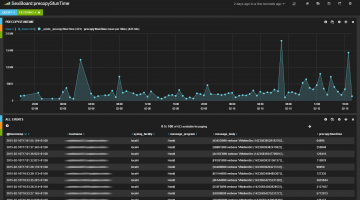
vMotion pre-copy stun time
The precopyStunTime dashboard let you visualize the reported vmotion pre-copy stun time as explained in the VMware…
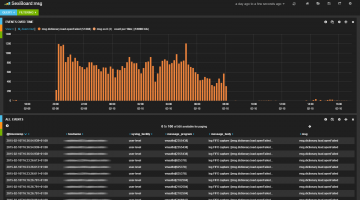
msg.*
The msg dashboard is a simple Kibana topN query on the msg field. This field is…
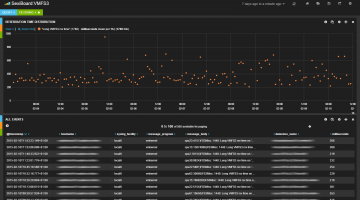
Long VMFS3 rsv time
The VMFS3 dashboard helps you visualize how bad are the “Long VMFS3 rsv time” issues. This message…
SCSI Sense Data
When something wrong happens on your SCSI network (FC, iSCSI, infiniband, FCoE, etc…), error messages…
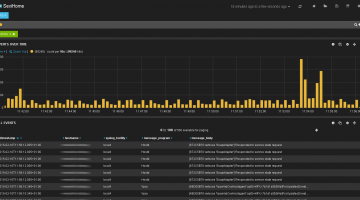
SexiHome
We changed the default dashboard so that SexiHome is the new home of your ESXi logs:…
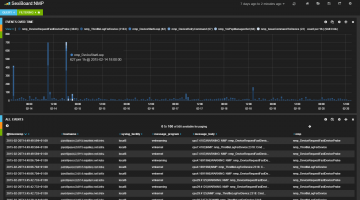
NMP_
NMP stands for Native Multipathing. The NMP is an extensible module that manages subplugins. […] –…
Veeam B&R
The VeeamBR dashboard template is based on SNMP traps that you can configure from the…
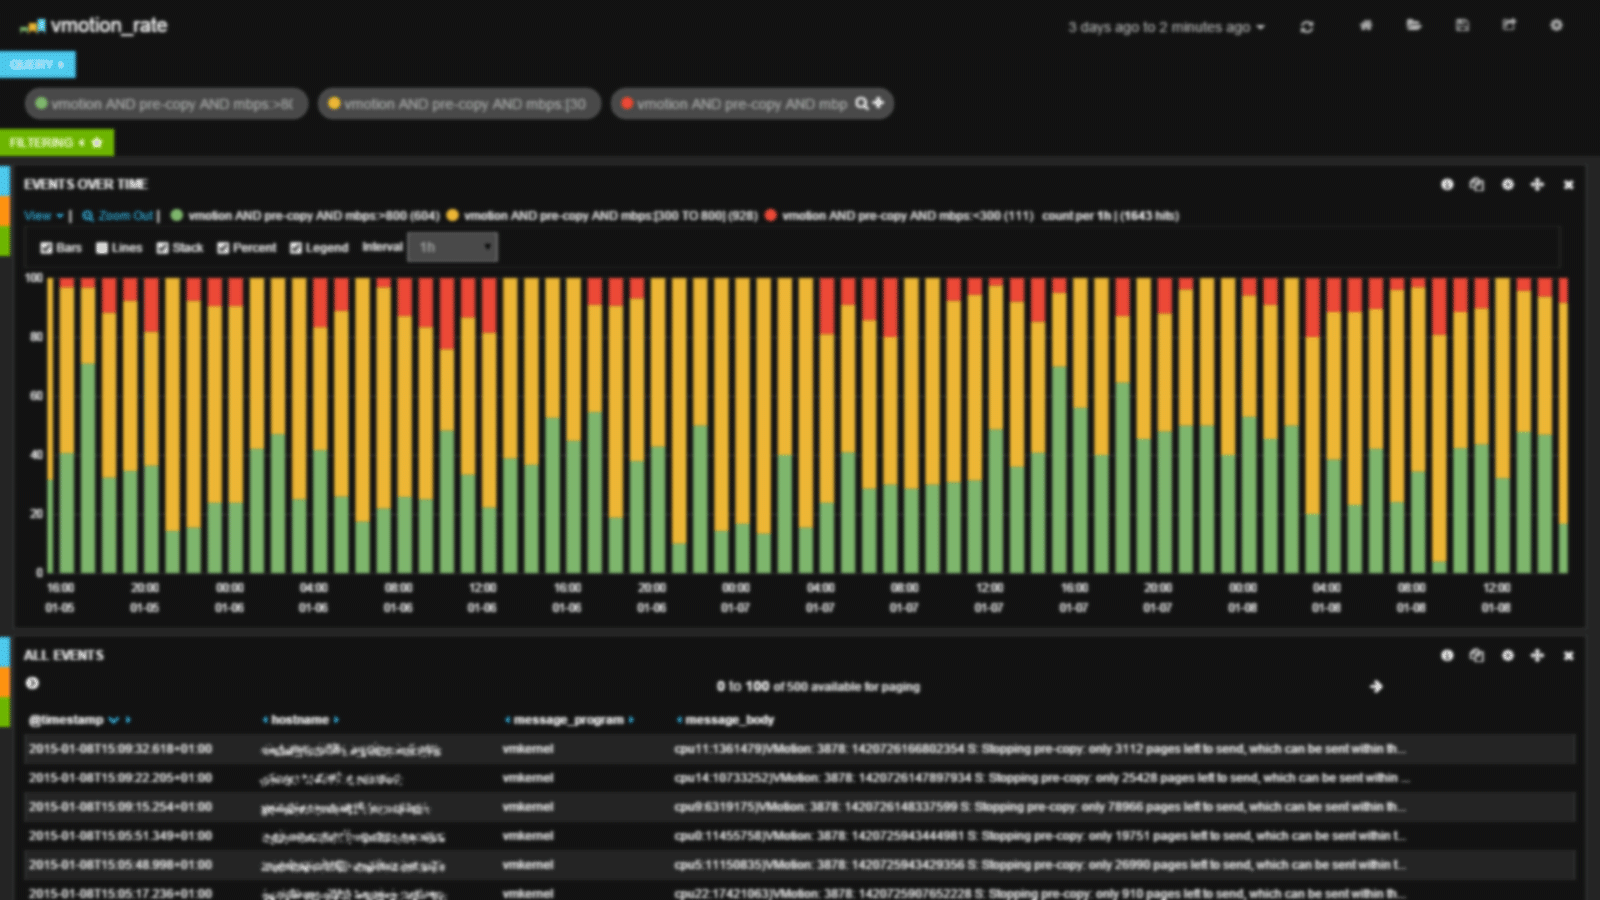
vMotion pre-copy rate
As described in VMware vSphere vMotion Architecture, Performance and Best Practices in VMware vSphere 5 Performance…
snapshot request
During backup, lots of snapshots create and remove requests are sent to your vSphere infrastructure.…
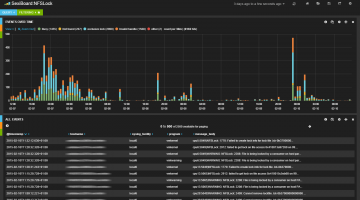
NFSLock
The NFSLock dashboard is a compilation of the major NFSLock issues like Busy, Not found, exclusive lock…
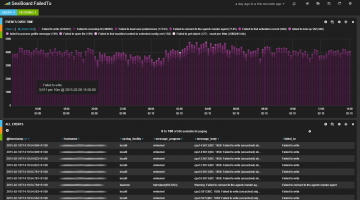
Failed To *
The FailedTo dashboard is a simple Kibana topN query on the failed_to field. This field is created…
IORM
The IORM dashboard is designed to let you have a quick look on the SIOC (aka Storage I/O…
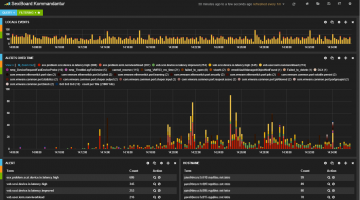
Kommandantur
Kommandantur is the most critical SexiLog’s dashboard. When something becomes wrong, you’ll know it in real…
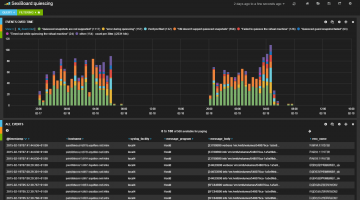
Quiescing issues
You probably already have encounter snapshot quiescing issues during VM backup jobs. The quiescing dashboard…
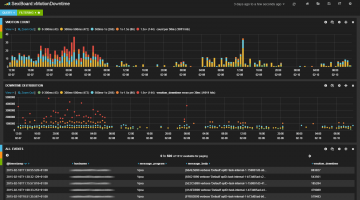
vMotion downtime
During the vMotion hot migration process, the moved VM is quiesced/stunned very shortly for multiple steps (pre-copy,…