SexiBoards

Long VMFS3 rsv time

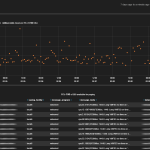
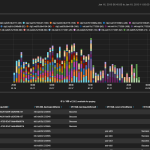
The VMFS3 dashboard helps you visualize how bad are the “Long VMFS3 rsv time” issues. This message is logged when a SCSI Reserve/Release operation (SCSI Reservation > Perform I/O > SCSI Release) takes longer than expected to complete. The expected reservation time is very fast, and if the reservation time exceeds 200ms, this message is reported. This is defined as the maximum… Read more →

SCSI Sense Data

When something wrong happens on your SCSI network (FC, iSCSI, infiniband, FCoE, etc…), error messages rise in ESXi logs. When a SCSI target device returns a check condition in response to a command, the initiator usually then issues a SCSI Request Sense command. This process is part of a SCSI protocol called Contingent Allegiance Condition. The target will respond to… Read more →

SexiHome

We changed the default dashboard so that SexiHome is the new home of your ESXi logs: .   The classic Logstash Search dashboard is still available at http://your_appliance_fqdn_or_ipv4/#/dashboard/file/logstash.json if you need to explore other logs:   Read more →

NMP_

NMP stands for Native Multipathing. The NMP is an extensible module that manages subplugins. […] – Manages physical path claiming and unclaiming. – Registers and de-registers logical devices. – Associates physical paths with logical devices. – Processes I/O requests to logical devices: – Selects an optimal physical path for the request (load balance) – Performs actions necessary to handle failures and… Read more →

Veeam B&R

The VeeamBR dashboard template is based on SNMP traps that you can configure from the Veeam Backup console. On every VM/job event, a trap is sent to SexiLog and parsed by logstash. .    . Based on job names, the VeeamBR dashboard helps you visualize jobs progression over time: .    Read more →

vMotion pre-copy rate

As described in VMware vSphere vMotion Architecture, Performance and Best Practices in VMware vSphere 5 Performance Study: Because the virtual machine continues to run and actively modify its memory state on the source host during this phase, the memory contents of the virtual machine are copied from the source vSphere host to the destination vSphere host in an iterative process. The first iteration… Read more →

NFSLock

The NFSLock dashboard is a compilation of the major NFSLock issues like Busy, Not found, exclusive lock or Invalid handle: .   If you need to troubleshoot, for instance start|stop accessing issues, just deactivate other filters to focus on your needs:     Associated VMware KB articles: http://kb.vmware.com/kb/2016122 http://kb.vmware.com/kb/2046165 http://kb.vmware.com/kb/2037507 http://kb.vmware.com/kb/2013834 http://kb.vmware.com/kb/2009718   Read more →

Failed To *

The FailedTo dashboard is a simple Kibana topN query on the failed_to field. This field is created everytime logstash see something like “failed to do something“. In the screenshot below, you may have noticed a lot of “Failed to write” which was actual SIOC alerts because of a storage issue.   Read more →

IORM

The IORM dashboard is designed to let you have a quick look on the SIOC (aka Storage I/O Control) latency of your datastores. If you see some unexpected high latency here, go check on your monitoring-less SAN team 🙂 Datastore latency is one of the most important storage performance counter to look at. Having high storage latency could dramaticaly impact your VM performances. . . This dashboard… Read more →