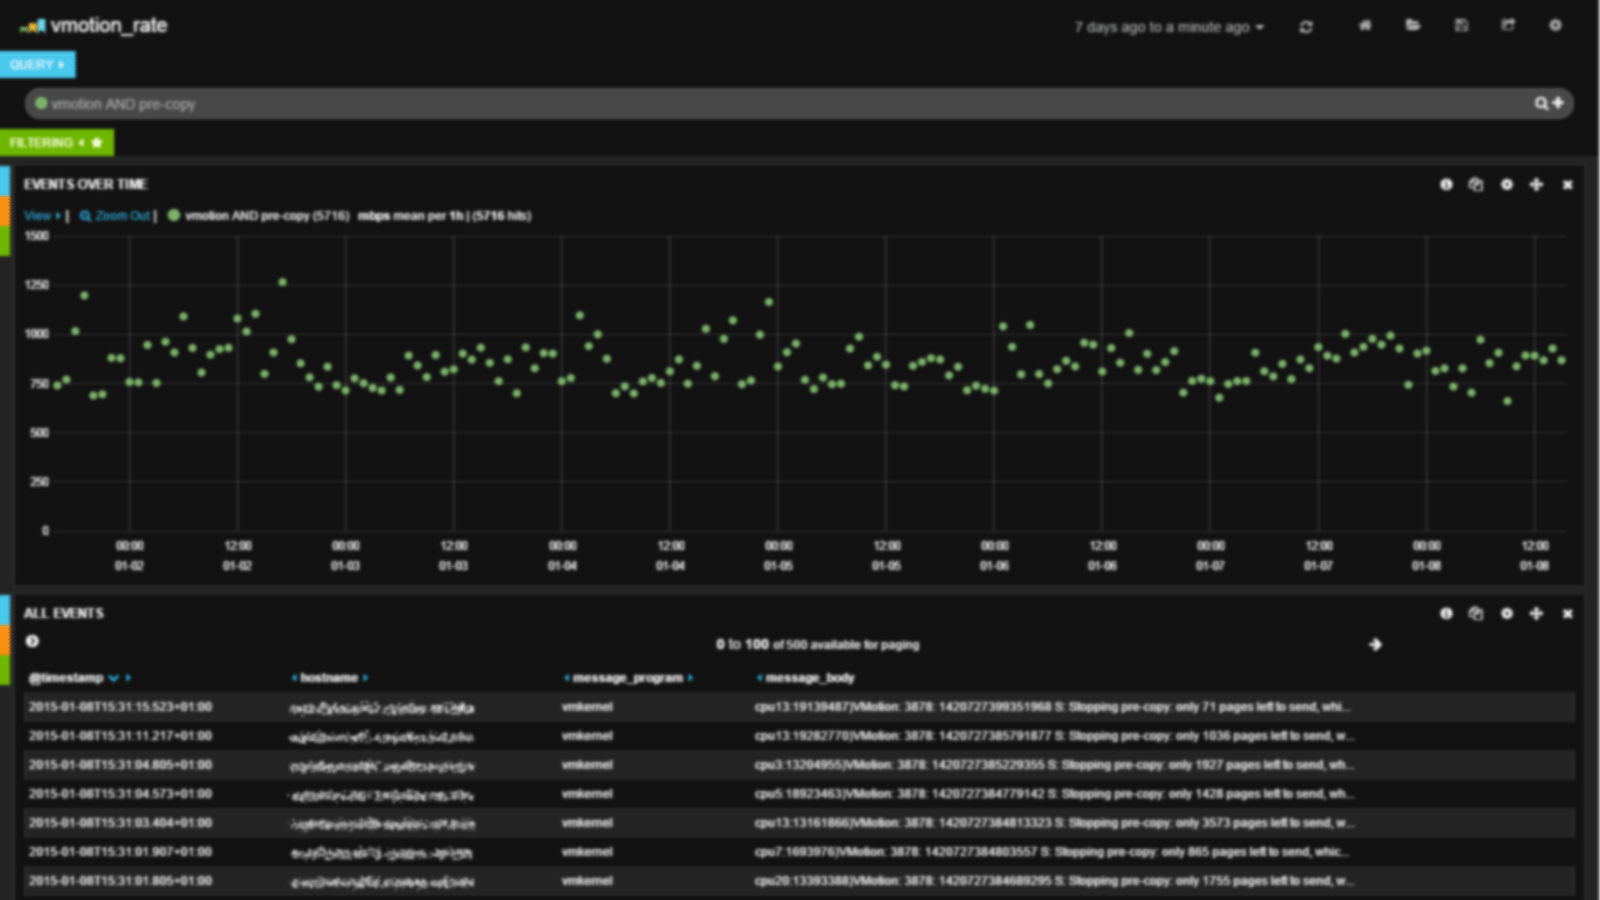
During a mini VSAN outage (disk full), we collected some critical logs and made a quick dashboard out it: . 2015-06-27T14:33:01Z PRD-ESX-03.adm clomd[33804]: CLOMBalance_RebalanceDisk: Trying to liberate 126831858249 bytes from disk 5299e143-070f-22d6-836f-fca7d91952c4 (Cap:990191288320 Used:990191288320) in normal mode 2015-06-27T11:30:00Z PRD-ESX-02.adm clomd[33804]: CLOMBalance_CopyMoveListToWorkItem: Rebalance component 39f78655-dfcb-1208-dcc0-44a842147fac of object bdf68655-ef99-97ee-230a-44a842147fac to 52831702-ae93-04d8-9f03-0713551e3f41 2015-06-27T11:32:03Z PRD-ESX-03.adm clomd[33804]: Setting rebalanceInProgress to TRUE 2015-06-27T11:30:06Z PRD-ESX-01.adm clomd[33803]: Sync”… Read more →