If you ever need to extract logs from your favourite appliance, the guys from Hypervisor.fr have written a tiny Powershell script for that purpose. Read more →
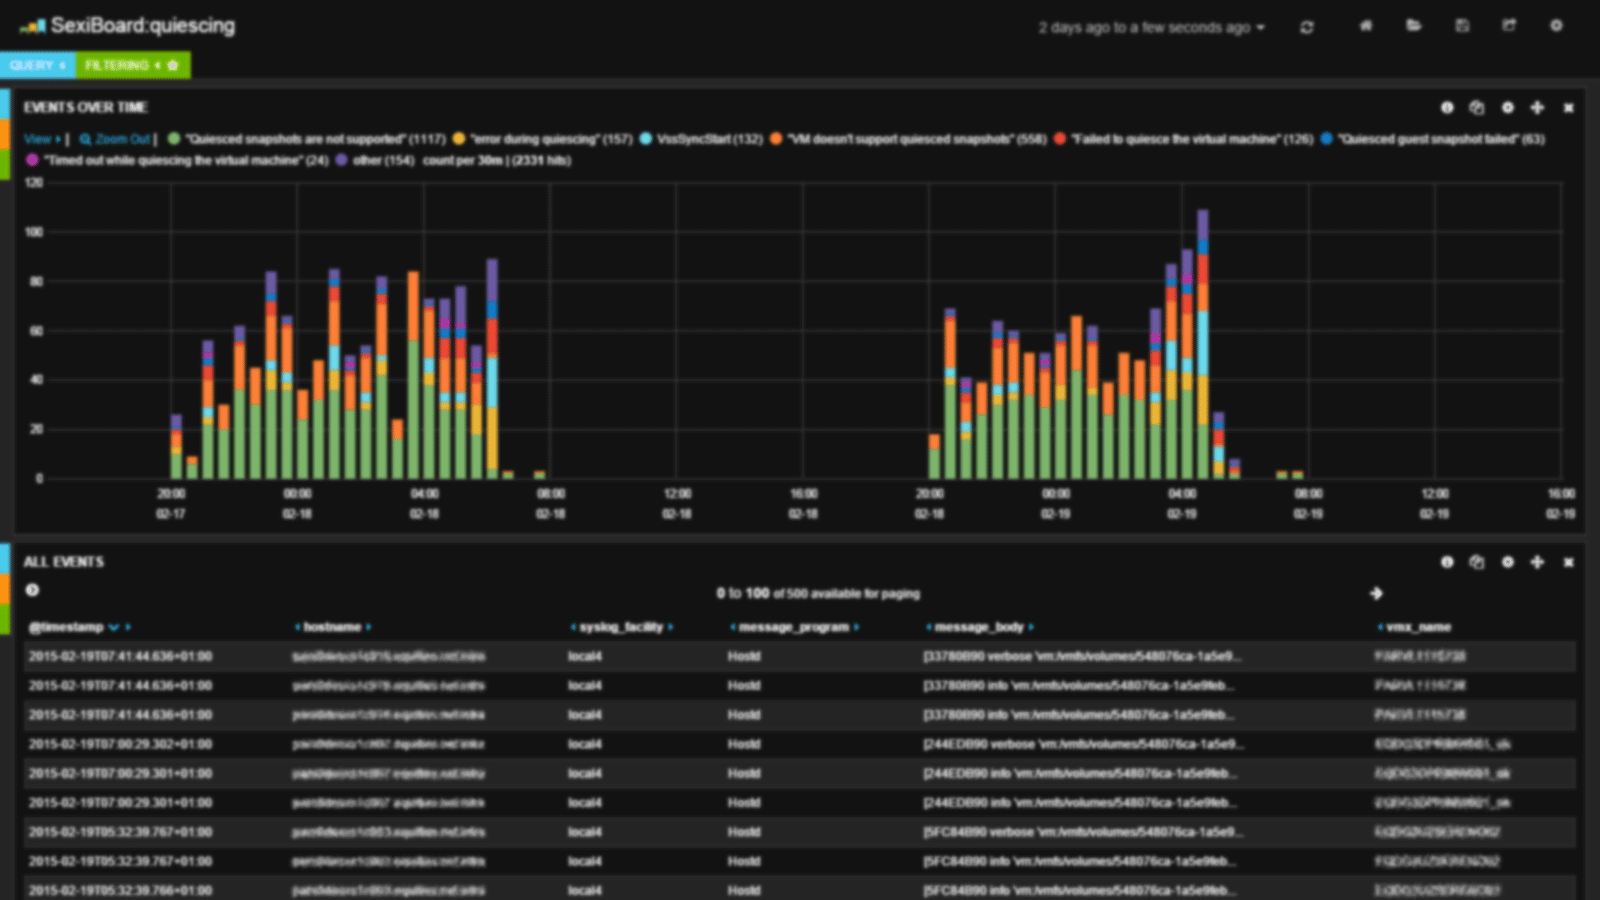
sexilog
SexiLog VeeamLive event (french content)
Nous avons eu le privilège d’être invité chez Veeam France pour parler de SexiLog et de son utilisation avec Veeam Backup & Replication. Pour ceux qui n’ont pas eu la chance d’assister à l’événement en live, l’enregistrement est maintenant disponible sur YouTube : Read more →
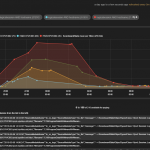
VSAN
During a mini VSAN outage (disk full), we collected some critical logs and made a quick dashboard out it: . 2015-06-27T14:33:01Z PRD-ESX-03.adm clomd[33804]: CLOMBalance_RebalanceDisk: Trying to liberate 126831858249 bytes from disk 5299e143-070f-22d6-836f-fca7d91952c4 (Cap:990191288320 Used:990191288320) in normal mode 2015-06-27T11:30:00Z PRD-ESX-02.adm clomd[33804]: CLOMBalance_CopyMoveListToWorkItem: Rebalance component 39f78655-dfcb-1208-dcc0-44a842147fac of object bdf68655-ef99-97ee-230a-44a842147fac to 52831702-ae93-04d8-9f03-0713551e3f41 2015-06-27T11:32:03Z PRD-ESX-03.adm clomd[33804]: Setting rebalanceInProgress to TRUE 2015-06-27T11:30:06Z PRD-ESX-01.adm clomd[33803]: Sync”… Read more →
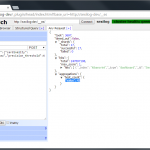
How many sources hit my SexiLog?
Kibana 3 doesn’t have a great way to visualize the sources count overtime but it is possible to ask gently to your ElasticSearch db 🙂 So until SexiLog comes with Kibana 4, you can use the awesome head plugin to achieve this goal. Just copy/paste the following query in the “Any Request” tab and check the “value” property: {“aggs”:{“host_count”:{“cardinality”:{“field”:”hostname.raw”,”precision_threshold”:40000}}}} … Read more →

Immigrating
The Immigrating dashboard let you visualize the top 20 most frequently migrated VM the last 7 days (manual, initiated by DRS or “self” vmotion – aka Storage vMotion Fast Suspend/Resume). If a cluster is heavily loaded or if the DRS migration threshold is too aggressive, some VM might be moved very often. Moreover, due to “self” vmotion, fully automated SDRS may also be source of… Read more →
WinEventType
The WinEventType dashboard gives you a quick look over the Windows EventLog types repartition over time. By toggling the event type queries you can focus and leverage the Micro Analysis feature of Kibana on the Message field to quickly find the root cause of warnings and errors. Read more →
IOPS
The IOPS dashboard is designed to let you have a quick look on the SIOC (aka Storage I/O Control) IOPS metric of your datastores. This dashboard is of course higly related to the IORM SexiBoard that provide latency metrics. Like the datastore latency metric, having high IOPS activity could impact your storage performances. . . This dashboard is actually a template and needs a bit of… Read more →
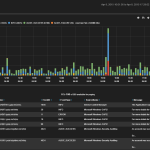
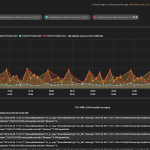
ScoreboardStats Logical Session
The LogicalSession dashboard leverage one of the vpxd-profiler statistic counters logged in vpxd-profiler.log file. The Vpxd::Session::LogicalSession counter helps you track the vCenter server active & idle connexions limited by the maxSessionCount vpxd.cfg parameter. In the following screenshot you can observe vCenter connections during backup window. This dashboard actually helped troubleshooting a real backup jobs scheduling issue as the default maximum session count was reached sometimes.… Read more →
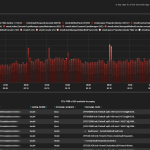
SQL execution took too long
This dashboard is aimed at keeping track of SQL response time from a vCenter point of view. A healthy database backend is a must for vCenter Server, as a lot of thing is done in db. SQL execution times are extended and take a long time to complete. If you have performance issue with your db server, there will be a… Read more →
vmodl.*
VMODL stands for VMware Managed Object Design Language. The vmodl dashboard is a simple Kibana topN query on the vmodl field. This field is created everytime logstash see something like vmodl.fault.object. Read more →